• Blog
  • Wastewater Testing
  • Bioaugmentation Applications
  • Useful Information
  • About Us
BIOLOGICAL WASTE TREATMENT EXPERT
Contact Us

About solids yield - what determines kg of biosolids per kg of loading

3/25/2019

 
Picture
Cell yield is the amount of biological solids per unit of loading. Loading can be described as specific chemicals (ex. glucose or ammonia) but often we use BOD5 or COD as a proxy given the mixed nature of wastewater influent.  Cell yield is higher when the energy source (food) provides more energy for cell division. 

For domestic wastewater BOD5, we usually use 0.5 - 0.6 grams biomass per gram BOD5 in the influent as the yield (Y). In this case biomass includes living cells, extra cellular polymers (EPS), and all substances in the floc (MLSS). As handling and disposing of biological solids is expensive, often we would like to lower yield or amount of wasted biosolids.

Potential ways to decrease solids yield:
  • Increase sludge age (Lower F/M) - by increasing biological solids in the system, you are moving along the growth curve to endogenous respiration or decline phase growth. With very low F/M, cells consume adsorbed organics and extracellular materials. This is exactly what happens in an aerobic digester. Costs for running in extended aeration mode include more energy requirements for maintaining D.O. and clarifier solids capacity to handle the increased solids flux (more solids to clarifier).
  • Fixed film or MBBR addition - The addition of biofilm technology to an activated sludge system works by increasing biological solids. The film part keeps the biological solids out of the secondary clarifier. You still need to budget for more oxygen requirements from added biomass in the aeration basin.
  • Bioaugmentation - You often read about adding enzymes, micronutrients, or 'bugs' to a system and seeing reduced cell yield. This works in higher F/M conditions where adding microbes helps move along the growth curve. It also helps when influent components, such as FOG, create conditions where water and insoluble compounds build up in the MLSS resulting in larger volumes of solids (bacteria yield is actually the same but you have less water and EPS in the wasted solids). 
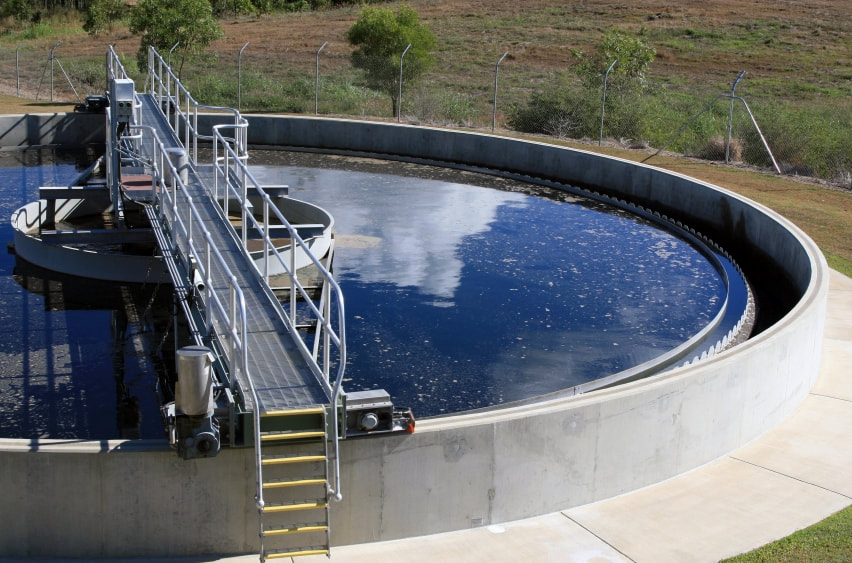
Biological solids production is a given in a wastewater system. You can reduce solids by operating at decline/endogenous phase growth, but this requires energy for D.O. , maintaining solids in suspension (or providing a MBBR/fixed film support), and having secondary clarifiers capable of handling the biological solids  without carryover. No matter what strategy you use to minimize biological solids yield, you must eventually waste solids. What we call old sludge contains more particulates, dead cells, and inorganics than target MLSS. When you start consuming EPS that binds foc, the fine particles we call pin floc start to increase effluent turbidity and TSS. 

Microscopic exam: best five minute test for wastewater

3/18/2019

 
Picture
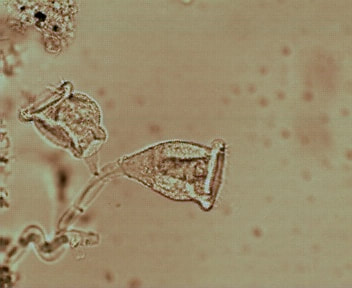
Stalk Ciliate photo using a low cost, used light microsope.
The daily microscopic exam gives you information on multiple parameters that effect your wastewater treatment system. Consider that a quick look under even a basic microscope gives you information on organic load (BOD5), dissolved oxygen, toxicity, settling potential (floc formation), and early warning of bulking. All this with a quick test, no specialty test reagents, or complex equipment. While we all talk about stains and phase contrast microscopes, even a lower end light microscope gives your great information as long as you look at the biomass daily. If you only have a simple light microscope, note the following and you will be well on the way to having a great test for detecting potential changes and problems. Here is what to note:
  1. Floc - even at 10x objective (100x magnification on most microscopes), you can take note of floc size, density, and amount of non-biological particles in the MLSS. Also not clarity of water between floc - this indicates if you have smaller free bacteria or particles in solution.
  2. Filaments - while not as obvious without phase contrast, filaments become visible when bulking occurs. You can also make out the "fingers" of non-filamentous bulking also called Zoogleal bulking. If you have ongoing filament problems and no budget for phase contrast, invest in a Gram Stain kit. The Gram Stain helps improve the view for about $50 for many tests.
  3. Protozoa & other indicator organisms - these are the easily seen and interesting organisms to monitor with the microscope. Protozoa are unicellular organisms that "graze" on bacteria and other things in the water. Unlike bacteria, we can see protozoa type and activity with any microscope. Download a chart as a guide to evaluating protozoa and seeing how these guys relate to F/M, sludge age, and biomass "health". I have one here if you don't have one: https://www.biologicalwasteexpert.com/useful-information.htm
Microscopic exams are most useful when run daily. If we only look when problems happen, you do not know what the MLSS looks like under good operating conditions. Also knowing early signs of problems, helps alert you to changing conditions and you can prevent bigger problems. No matter how old or simple,. dust off the microscope and use it.

(If your microscope is in bad shape, there are cleaning/repair shops that can make it like new for much less than the cost of buying a new microscope. (I use Land, Sea and Sky here in Houston for regular cleaning and maintenance on my microscopes. If you are not local, you can arrange to ship for cleaning/maintenance.)

Foam on the aeration basin? Causes & fixes

3/11/2019

 
Picture
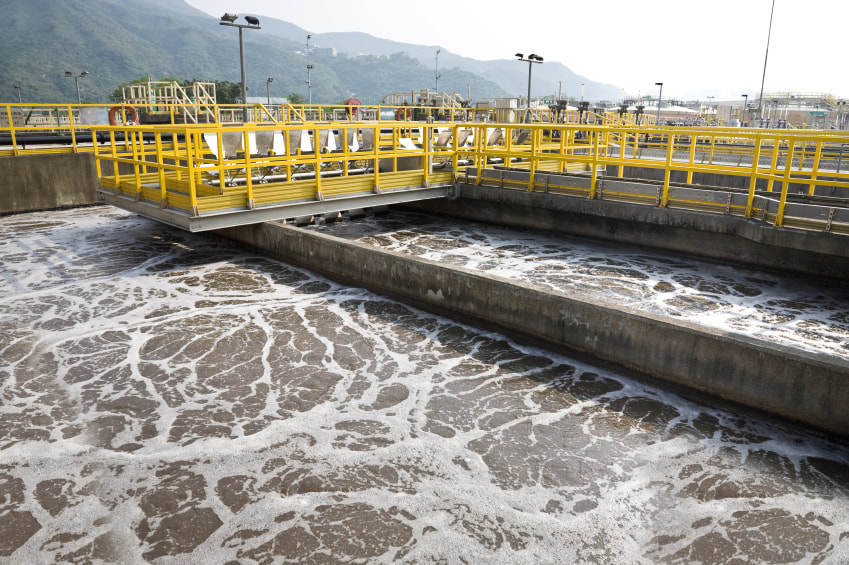
Healthy, biological foam on aeration basin
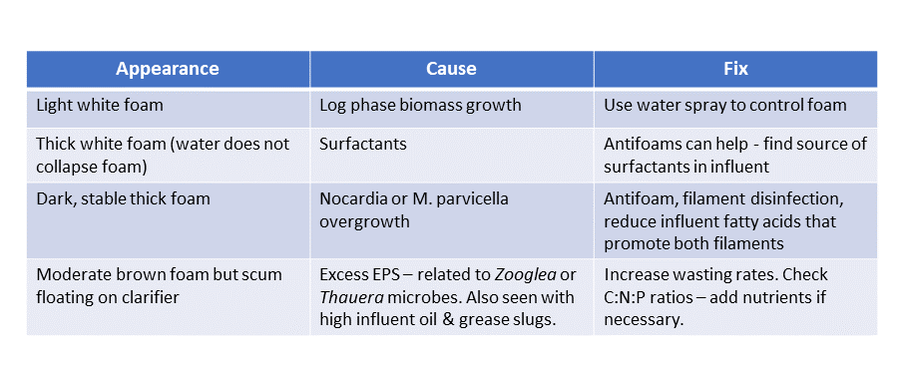
Do not overlook the power of simple observation in running a wastewater treatment plant. Changes in color, odor, or foam all tell you that something has changed. Having received several questions on aeration basin foam, I figured it was time to make a table on causes and cures for foam. While not an exhaustive list, these are the foams that I see most often.
Picture

Can you fix an anaerobic digester producing too much hydrogen sulfide?

3/7/2019

 
Picture
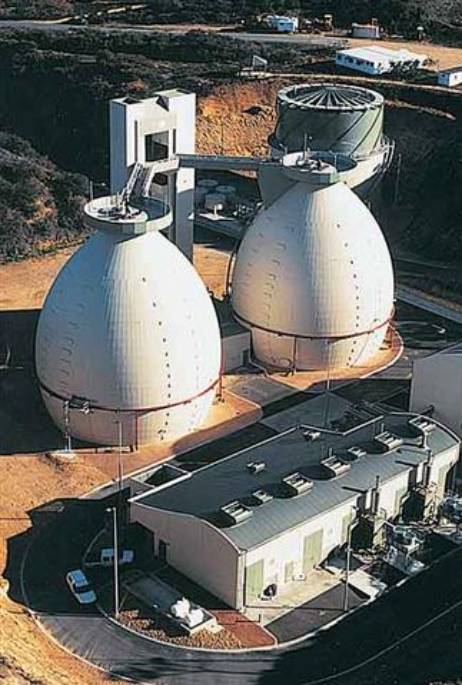
Anytime you operate under anaerobic conditions, you are subject to growth of unwanted sulfur reducing bacteria that produce hydrogen sulfide. The SRB organisms use sulfate and elemental sulfur as an electron acceptor for cellular respiration.  In a digester with no free oxygen, nitrate, or other more favorable energy yielding electron acceptor, the SRB organisms can obtain more energy than the desirable acid forming (fermentative) bacteria that produce short chain organic acids and hydrogen used by the methanogens. Having looked at studies of anaerobic digesters, there are ways to optimize the environment for the "good" acid forming bacteria and reduce conditions favoring SRB.  Here are the options that don't involve extensive capital or chemical expense.
  • Remove highest SO4 containing streams from the digester
  • Increase influent pH - SRB do not thrive above 8.0 pH (literature gives 8.5 as a good target)
  • Maintain proper digester temperature
  • Add micronutrients if you suspect an influent lacking trace metals - Cu, Fe, Ni, Zn, Co, Mn, Mg - remember some of these can be toxic if too high - so check your influent and effluent residuals.
​​

    Author

    Erik Rumbaugh has been involved in biological waste treatment for over 20 years. He has worked with industrial and municipal wastewater  facilities to ensure optimal performance of their treatment systems. He is a founder of Aster Bio (www.asterbio.com) specializing in biological waste treatment.

    View my profile on LinkedIn

    RSS Feed

    Click to set custom HTML

    Archives

    September 2021
    August 2021
    June 2021
    April 2021
    March 2021
    February 2021
    December 2020
    November 2020
    October 2020
    September 2020
    August 2020
    July 2020
    June 2020
    May 2020
    April 2020
    March 2020
    February 2020
    January 2020
    December 2019
    November 2019
    October 2019
    September 2019
    August 2019
    July 2019
    June 2019
    May 2019
    April 2019
    March 2019
    February 2019
    January 2019
    December 2018
    November 2018
    October 2018
    September 2018
    August 2018
    July 2018
    June 2018
    May 2018
    April 2018
    March 2018
    February 2018
    January 2018
    December 2017
    November 2017
    October 2017
    September 2017
    August 2017
    July 2017
    June 2017
    May 2017
    April 2017
    March 2017
    February 2017
    January 2017
    December 2016
    November 2016
    October 2016
    September 2016
    August 2016
    July 2016
    June 2016
    May 2016
    April 2016
    March 2016
    February 2016
    January 2016
    December 2015
    November 2015
    October 2015
    September 2015
    August 2015
    July 2015
    June 2015
    May 2015
    April 2015
    March 2015
    February 2015
    January 2015
    December 2014
    November 2014
    October 2014
    September 2014
    August 2014
    July 2014
    June 2014
    May 2014
    April 2014
    March 2014
    February 2014

Proudly powered by Weebly
Photos used under Creative Commons from Picturepest, marcoverch, perzonseowebbyra, Picturepest, Picturepest, dsearls, dungodung, Massachusetts Office of Travel & Tourism, aqua.mech, vastateparksstaff, hile, Aaron Volkening, amishsteve, Neil DeMaster, mklwong88, KOMUnews, Picturepest, kaibara87