• Blog
  • Wastewater Testing
  • Bioaugmentation Applications
  • Useful Information
  • About Us
BIOLOGICAL WASTE TREATMENT EXPERT
Contact Us

Environmental Genomics testing and the research bottleneck - a great post by Paul Campbell, head of Aster Bio's molecular testing lab

8/30/2018

 
Picture
From: www.linkedin.com/pulse/research-bottleneck-paul-campbell/
Also check out Aster Bio's new Environmental Genomics website for more information: www.environmentalgenomics.com

Our ability to discover new microorganisms far exceeds our ability to understand and confirm the roles that they may play in different environmental niches. 

You can extract DNA from almost any random environmental sample, subject it to next-generation sequencing to identify the metagenomes in the sample, and generate a fairly complete genome of a never-seen-before, never-cultured microbial strain. Then, wham, you run into the research bottleneck: how do you discover the role that your new, favorite microbe plays in the world?

Hard work and time. Bioinformatic analysis of the genome can provide insights into the potential metabolic activities your microbe may have (and, by extension, some of the roles it may play). Tracking co-occurrence and co-exclusion patterns with samples taken under different conditions helps, too. But, eventually, you just have to isolate the strain and start running tests.

This is highly relevant to wastewater microbial community analysis. For example, we occasionally find the genus Ferruginobacter to be the dominant strain in some wastewater plants, but completely absent from others. So, what's it doing?

The genus Ferruginobacter was first reported in 2009 (Lim et al., DOI 10.1099/ijs.0.009480-0). It's an obligate aerobe that doesn't denitrify (it won't reduce either nitrate or nitrite). Members of the genus are heterotrophs, although there are differences in the carboon sources they can grown on. So, what makes it so common in the biomass of one wastewater treatment plant and absent in another?

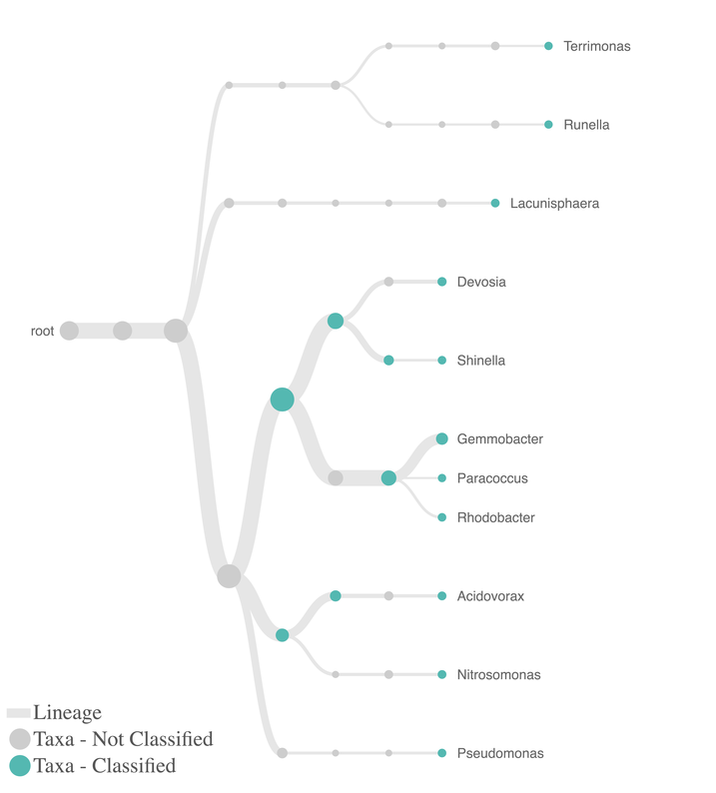
This is not an uncommon phenomenon. Scientists continue to discover new bacteria and archaea all the time, so for the foreseeable future, "I don't know" will be a common reply to "Why is this microorganism in my wastewater?" The good news? Generally speaking, a significant portion of the abundant genera have been studied, in some cases for over a century (Clowes, 1900. DOI 10.1038/062128b0), because they were abundant and easy to isolate. These key taxa do provide a lot of insight into how a particular wastewater treatment plant operates.

Why is it so hard to maintain ammonia removal in wastewater treatment systems?

8/21/2018

 
When compared to BOD/COD removing microbes, we spend an inordinate amount of time monitoring or worrying about ammonia oxidizing bacteria (AOB) and nitrite oxidizing bacteria (NOB) populations. What makes these bacteria so difficult to maintain in a wastewater treatment unit? Here are a few reasons:
  • Both AOB & NOB are slow growing when compared to many heterotrophic organisms. They are among the slowest growing organisms in the biological waste treatment unit.
  • Require a relatively narrow pH range - AOB/NOB work between roughly 6.8 - 8.2 pH. Outside the range you have problems with substrate toxicity or substrate not being available to the microbes.
  • Must have D.O. - oxidizing ammonia requires oxygen. Even newer Anaerobic Ammonia Oxidation (ANAMMOX) systems must have an aerobic section to produce nitrite before the anaerobic step.
  • Alkalinity - in addition to maintaining pH stability, carbonates also provide carbon for AOB/NOB cell growth.
  • Easily harmed by many common influent compounds - this list includes phenol, cyanide, sulfides, and many surfactants or household chemicals.
  • Require most COD/BOD to be removed for a population to develop - this is a low F/M where competition for dissolved oxygen and micronutrients drops.
  • Temperature - AOB/NOB do not grow well at low or high temperatures. The general good growth range is 15 - 35 Deg C. 

Detecting chronic toxicity early - it can be done!

8/13/2018

 
Picture
Aster Bio's Microbial Community Analysis gives a full picture of all organisms present in MLSS. Line width shows relative % of microbial population.
In my last post, I covered the differences between acute and chronic toxicity. While acute toxicity rapidly kills or harms your biomass, chronic toxicity tends to be a longer term loss of activity. Instead of an instant kill, chronic toxicity works by growth inhibition. As organism reproduction slows, the desired microbes can start to decrease as a percentage of total biomass. For example, ammonia oxidizing bacteria (AOB) have a very slow growth rate compared to most heterotrophic microbes. If we inhibit this slower growth rate, the AOB population drops resulting in eventual ammonia breakthrough into the effluent.

Since it does not happen instantly, chronic toxicity can sneak up on operators. There has been little way to detect chronic toxicity problems until you had significant microorganism loss or inhibition. However, this post is not all gloom & doom - a new way to monitoring exists that detects chronic toxicity before treatment efficiency falls. The new monitoring technology - Aster Bio's Environmental Genomics - DNA based monitoring.

DNA is present in all organisms and we can use this DNA to identify which organisms are present. Using Environmental Genomics testing, Aster Bio can do a complete microbial census of everything present in MLSS - full sequencing of all DNA present. For routine chronic toxicity testing, we can monitor population of target organisms such as AOB/NOB, sulfur reducing organisms (SRB), and bulking/foaming filaments among other organisms. In fact, we can customize our rapid qPCR tests for any target organism in a wastewater plant.

The advantages of using qPCR testing include:
  • Rapid results - can be rushed, no waiting weeks
  • Quantitative - unlike microscopic exam or trailing indicators, DNA can be quantified
  • Sensitive - for detecting chronic toxicity you need early detection. qPCR will pick up changes in population before any other test including plate counts, respiration, ATP, or microscopic exam.

The difference between acute & chronic toxicity

8/6/2018

 
Often you hear about chronic and acute toxicity when discussing effluent bioassay (biomonitoring) with test organisms. Both concepts are important for biological units that are having issues with ammonia oxidation, deflocculation, and COD/BOD removal. Over the next few posts, I am going to go into acute vs chronic toxicity with specific examples. In this post, I am going to make sure we all agree what is acute vs chronic toxicity.

Acute Toxicity - something that damages organisms immediately upon exposure. Focus on the fast kill part! Acute toxicity is often seen with pH swings, phenol, cyanides, or solvents. In bioassay tests, this is the die off of test organisms. With wastewater bacteria, acute toxicity usually comes with an immediate loss of nitrification and deflocculation. As soon as the acute toxic compound washes out or the biomass adapts, the system starts to recover.

Chronic Toxicity - a slower, accumulating toxic effect. Often we see metals that buildup in biomass as a source of chronic toxicity. You will not see the sharp change in biomass with chronic toxicity. Instead, a loss of treatment efficiency will take hold over time. In bioassay tests, chronic toxicity manifests itself as low reproduction or failure to see weight gain.


Color & foam - two easily monitored wastewater parameters that should be recorded

8/2/2018

 
Recording color and foam changes is a great, simple way to monitor wastewater treatment systems. While you cannot use color and foam alone - you need to do the standard battery of tests including SV30, D.O., OUR, microscopic exam, MLSS - it is a quick, painless way to see changes in biomass. 

Color
Look at both the water and MLSS color. In systems with dye and highly colored influent, color observations are less accurate, but changes should still be monitored. A healthy MLSS is brown in color. The brown color results from bacteria cells, biological polymers, and particulate materials. Lighter brown usually indicates an immature biomass - where biopolymers are not at optimal levels. Dark colors - trending towards gray/black indicate older sludge, septicity, and if accompanied by odors, a problem with aeration/mixing. Colors are subjective and depend upon ambient light, so try to monitor changes and record observations. In summmary:
  • Light colors - indicate a younger sludge or less accumulation of particulates/biopolymers
  • Brown - usually a healthy sludge with a mixed microbial aggregate/biofilm
  • Dark brown - older sludge with more inert/particulates
  • Gray - very old sludge, start to lose biopolymer cohesion
  • Black - septicity, low D.O., also can be dyes

Foam
Foam originates from influent surfactants, biological polymers, and even microbial produce surfactants. For observation purposes: record depth, color, and foam stability. As foam is directly related to biological activity (again high surfactants in the influent can confound this observation) - it gives you great information on microbial activity. Here is how I interpret foam observations:
  • Deep, white foam that is stable - usually from influent surfactants
  • White foam that is not stable under water spray - biological foam from normal bacteria action. Very white foam often indicates younger sludge and log growth
  • Light brown foam - as the MLSS matures some of the brown color gets to the foam. This is normal.
  • Thick brown, stable greasy foam - this is often growth of Nocardia forms. These organisms thrive on long chain fatty acids and long sludge ages. Once you have foam, they are in excessive abundance and need to be wasted.
  • Gray, pumice like foam - this can be an indicator of "old" slduge or anaerobic conditions in the system.

Remember, noting color and foam are just observational tests. They should be done in conjunction with normal physical and laboratory tests. An observant operator can see if something has changed by looking at color or foam in a few seconds - unlike lab tests that can take several hours or days. So, start recording observations and it will help you maintain good biological waste treatment.

    Author

    Erik Rumbaugh has been involved in biological waste treatment for over 20 years. He has worked with industrial and municipal wastewater  facilities to ensure optimal performance of their treatment systems. He is a founder of Aster Bio (www.asterbio.com) specializing in biological waste treatment.

    View my profile on LinkedIn

    RSS Feed

    Click to set custom HTML

    Archives

    December 2022
    November 2022
    October 2022
    September 2022
    August 2022
    June 2022
    May 2022
    March 2022
    February 2022
    January 2022
    November 2021
    October 2021
    September 2021
    August 2021
    June 2021
    April 2021
    March 2021
    February 2021
    December 2020
    November 2020
    October 2020
    September 2020
    August 2020
    July 2020
    June 2020
    May 2020
    April 2020
    March 2020
    February 2020
    January 2020
    December 2019
    November 2019
    October 2019
    September 2019
    August 2019
    July 2019
    June 2019
    May 2019
    April 2019
    March 2019
    February 2019
    January 2019
    December 2018
    November 2018
    October 2018
    September 2018
    August 2018
    July 2018
    June 2018
    May 2018
    April 2018
    March 2018
    February 2018
    January 2018
    December 2017
    November 2017
    October 2017
    September 2017
    August 2017
    July 2017
    June 2017
    May 2017
    April 2017
    March 2017
    February 2017
    January 2017
    December 2016
    November 2016
    October 2016
    September 2016
    August 2016
    July 2016
    June 2016
    May 2016
    April 2016
    March 2016
    February 2016
    January 2016
    December 2015
    November 2015
    October 2015
    September 2015
    August 2015
    July 2015
    June 2015
    May 2015
    April 2015
    March 2015
    February 2015
    January 2015
    December 2014
    November 2014
    October 2014
    September 2014
    August 2014
    July 2014
    June 2014
    May 2014
    April 2014
    March 2014
    February 2014

Proudly powered by Weebly
Photos used under Creative Commons from Picturepest, marcoverch, perzonseowebbyra, Picturepest, Picturepest, dsearls, dungodung, Massachusetts Office of Travel & Tourism, aqua.mech, vastateparksstaff, hile, Aaron Volkening, amishsteve, Neil DeMaster, mklwong88, KOMUnews, Picturepest, kaibara87