• Blog
  • Wastewater Testing
  • Bioaugmentation Applications
  • Useful Information
  • About Us
BIOLOGICAL WASTE TREATMENT EXPERT
Contact Us

Why is the SV30 test only run for 30 minutes & other SV30/SVI questions answered

8/30/2017

 
For systems with secondary clarifiers, using the SV30 test to monitor MLSS is one of the most basic and informative tests for predicting secondary clarifier performance. I often receive questions on the SV30& SVI, so I wanted to post the questions and answers in one post:

Why run the test for 30 minutes - why not an hour or two which is more like the clarifier?
Unlike the clarifier, the SV30 settleometer or cylinder does not have flow or in most cases stirring with a rake. You are looking for three distinct things in the test:
  1. How fast d.oes the MLSS settle - readings at 5 min intervals can be helpful in problem systems
  2. How much pinfloc, fines, or turbidity is in the supernatant
  3. How well does the sludge compact at the bottom - good prediction for clarifier bed depth & RAS concentration
Is there a benefit to running the test for longer periods?
If we go beyond 30 minutes, we are looking more at sludge compaction. Since there is not stirring or flow, denitrification can start to compromise test results - although it can help explain floating solids in the clarifier and need to increase recycle rates. (MLSS in clarifier beds held too long can denitrify and float like DAF solids.

Is there an advantage to plotting the settling/compaction curve at 5 minute intervals?
In a one word answer, YES. More data helps troubleshoot and predict when the system is starting to have settling problems. Plotting the settling rates gives insight into filamentous and non-filamentous bulking, "old sludge", and can potentially inform you of spills, shock loadings. Remember, settling and TSS removal is the first thing to be affected during spills - followed of course by ammonia oxidation/removal.
Bilge water treatment in smaller boats & ships using biological cultures to remove hydrocarbons

8/29/2017

 
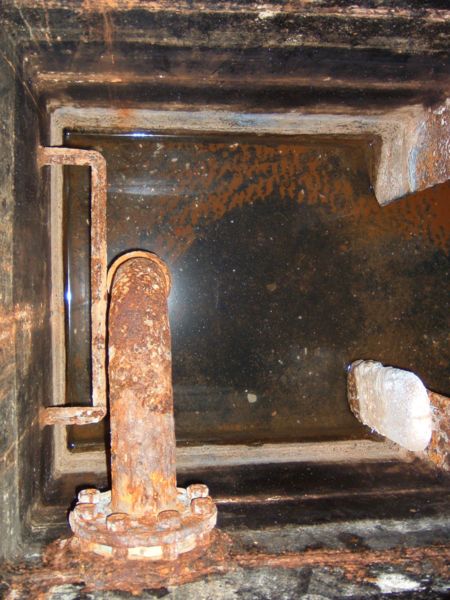
The bilge water in boats and ships collects in sumps during normal operations. The water collects contamination from various sources including engine lubricants, fuel, and detergents. When it comes time to discharge the bilge water, hydrocarbons should be removed to levels <15 mg/L by International Maritime Organization regulations. Smaller boats less than 400 tons are not covered under the IMO regulations. However local regulations exist on bilge discharges to prevent pollutants entering sensitive waters such as bays and estuaries. While large ships often have advanced treatment for oil water separation, smaller vessels do not have the space or budget for such advanced treatment. This led me to think about how bacteria could be used to treat bilge tanks. With mixing and aeration provided by boat movement, hydrocarbon degrading bacteria can develop in the bilge tank. These microbes need to be able to degrade hydrocarbons present under a wide range of salinities and lower oxygen conditions. Research has found hydrocarbon degrading organisms in bilge water, but not in sufficient concentrations to significantly remove criteria pollutants. 

Based on peer reviewed papers and internal strain characterization, Aster Bio's R&D worked on developing a bilge microbial consortia that would be convenient and cost-effective for all vessels. The resulting formulation contains a blend of non-pathogenic, non-GMO Rhodococcus sp. and Pseudomonas sp. that are active hydrocarbon degrading microbes that can thrive in the low oxygen and nutrient conditions of conventional bilge tanks. To enhance activity, we added a micronutrient and biosurfactants produced during fermentation to give the microbes a boost. The highly concentrated dry product increases the biological activity to needed levels with a dose of 25 - 40 grams per cubic meter of bilge tank volume. Higher doses are used in vessels with more hydrocarbon releases, usually older vessels. Once dosed, the bilge tank cultures will reproduce and maintain activity until bilge contents are released. 
Picture
Bilge Tank - From http://lms.seos-project.eu/learning_modules/marinepollution/marinepollution-c02-s08-p01.html

Using the Oxygen Uptake Rate test (DOUR) for toxicity evaluation & monitoring

8/24/2017

 
For those not familiar with the DOUR Test, here is link to the standard protocol (DOUR Test PDF). The DOUR test is very similar to more complex respirometry testing just a bit more suited for everyday monitoring application. The DOUR test utilizes a standard D.O. probe (one that fits in a BOD bottle), a BOD bottle, and a stir bar/plate to agitate the sample. 

Often we run the DOUR test on aeration basin water to indicate microbial respiration rate. Sudden increases indicate higher influent loadings (usually soluble organics or BOD5). We can also see similar decrease if a toxic shock that "kills" the biomass has occurred. Therefore, any sudden changes in DOUR test results should be investigated.

Using DOUR for Toxicity Evaluation
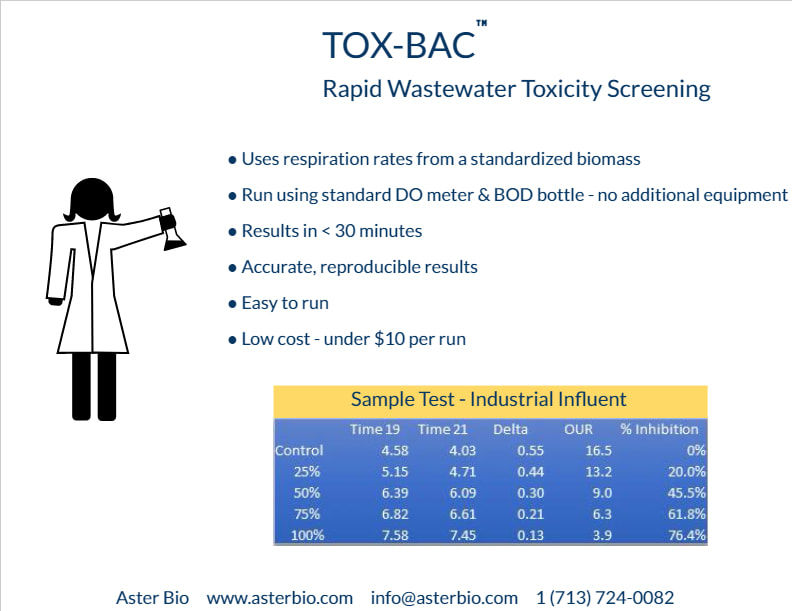
I also want to introduce the idea of using DOUR for toxicity evaluation. At Aster Bio, we use a known biomass (dried preserved microbes) in our Tox-Bac test. While the Tox-Bac known biomass is much more uniform and gives less variation in results, it is also possible to use existing biomass to evaluate wastes for biomass impact. What you do is take the stream for testing and make several dilutions. After saturating the sample dilutions with oxygen via shaking or an air stone, I add 20 - 50% by volume MLSS. Allow to aerate for 1 - 2 hours. What we are doing is spiking the DOUR with the new influent. Run the standard test protocol and determine changes in respiration rates. Use the changes from the 0% new influent bottle versus the added influent bottles to determine % inhibition. This test does not pick up chronic toxicity such as heavy metals or complex insoluble organics. It will pick up acutely toxic materials. 

Another option is to use the Aster Bio Tox-Bac culture. This test with dried microbes is standardized for expected oxygen uptake in the control flask. Each vial had the same culture makeup. The vial is akin to a standard municipal WWTP biomass. Instead of having to aerate for 1 - 2 hours, the test takes less than 30 minutes per sample run. I often use this when people are having problems while telling me the influent has not changed. Often, I pick up inhibition beyond normal levels relating to some upstream activity.

Picture

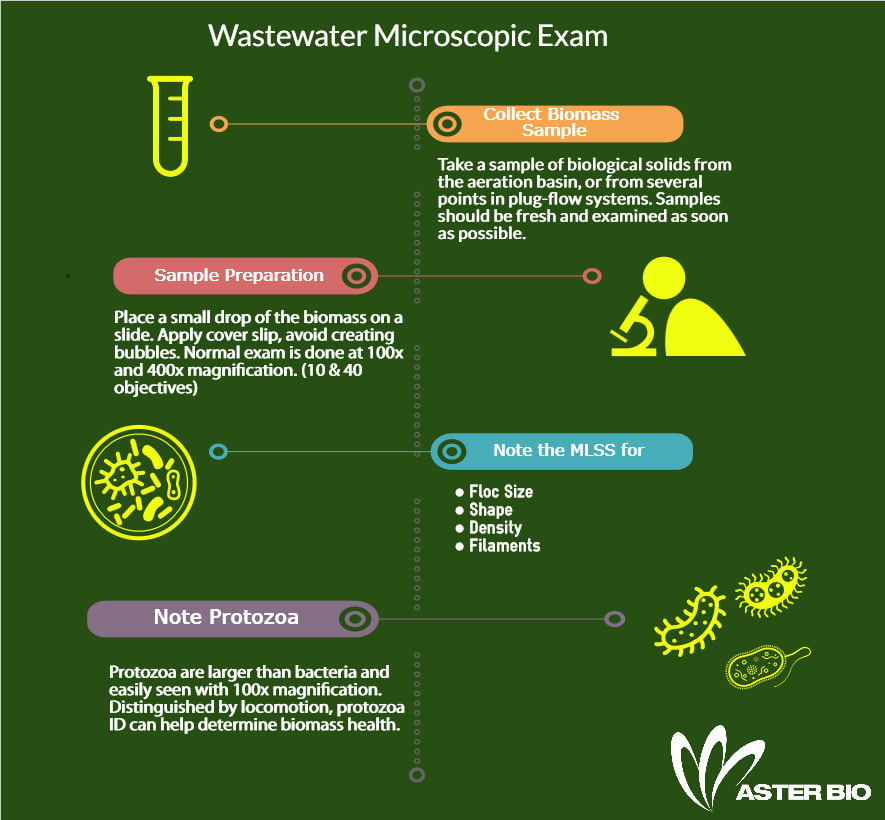
Wastewater microscopic exam basics

8/21/2017

 
Picture
Microscopic exam is one of the easiest and most useful tests for monitoring biological wastewater treatment unit biomass. To make microscopic exam useful it is best to follow a few rules:
  • Take sample from same location(s) each time
  • Perform exam as soon as possible. If doing exam after a few hours, make sure samples were refrigerated
  • Use 100x and 400x magnification (10x and 40x objectives on most microscopes).
  • Use phase contrast if possible. Phase contrast helps see more detail in living, unstained organisms.
  • Make sure to note floc size, density, shape, filament  abundance & location, and amount of solids outside floc
  • Now note the protozoa which are much larger and easier to see than bacteria. Classified by locomotion, protozoa are indicators of toxicity, soluble BOD/COD, dissolved oxygen, and shocks to the biomass.

How to present wastewater characterization and data to a consultant

8/14/2017

 
Picture
I know this sounds like a dull topic. However, I work with both engineers/operators and monitor on-line discussion groups to give feedback on their wastewater treatment problems or questions. One of the greatest challenges is communication! I can't tell you how often I hear:

Can I treat XXX?
What polymer should I use?
My biomasss is floating but nothing changed in the influent?

In ease case, the operator wants me to give a concise answer that definitely does not contain "it depends".

Here is how to get a better answer from consultants:
  1. More data is better - we can sort out the details if given a legend (key).
  2. For biological treatment, we like to know BOD5 as well as TOC/COD - remember BOD5 is the reasily biodegradable portion
  3. Are there any xenobiotics (toxic or quasi-toxic compounds) in the influent
  4. With Ammonia - give me influent TKN as nitrogen cycle not just ammonia is important
  5. Physical treatment system - with volumes, flows, layout help me. If you have a mass balance, it lowers my workload as I always like to do a mass balance when evaluating a system.
  6. Treatment goals - without goals where is treatment going!
  7. What solutions have you already tried in the past.

Remember, consultants are only as good as the information that they are given. Failure to communicate key information can result in poor results.

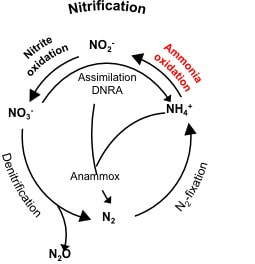
Nitrogen removal from a review of the microbial populations involved

8/7/2017

 
Picture
Graphic from http://dome.csb.univie.ac.at
Nitrogen exists in wastewater in multiple forms:
  • Organic such as proteins and urea
  • Ammonium/ammonia - the most toxic to animal life
  • Nitrite 
  • Nitrate
  • NO/N2 - gas
Heterotrophic Cycles
Microbes use nitrogen for cell maintenance and growth with nitrogen being used primarily for enzymes and proteins. Nitrogen accounts for 9 - 15% of the dry weight of cells. Bacteria can use many forms of nitrogen with the most efficiently used being ammonium with some organisms being able to use nitrogen gas (fixation) when other forms of nitrogen are deficient. Under anoxic conditions, many heterotrophic organisms can use nitrate or nitrite as an alternative electron acceptor (oxygen substitute). This produces NO/N2 gas - often seen as fine bubbles on the surface of clarifiers or lagoons. Another part of the nitrogen cycles includes heterotrophic oxidation of ammonia. While much less understood than chemoautotrophic nitrification, some heterotrophic microbes engage in ammonia oxidation in wastewater treatment. Research on the organisms and triggers for ammonia oxidation are ongoing - this also starts to dovetail into the Anammox cultures.

Chemoautotrophic Cycles
When we think of ammonia removal in wastewater, we usually discuss chemoautotrophic nitrification. These organisms including Nitrosomonas & Nitrobacter - obtain energy via the conversion of ammonia into nitrite and finally nitrate. This is an obligate aerobic process and consumes substantial alkalinity. Both AOB & NOB microbes are relatively slow growing and susceptible to toxic shocks. 

Anammox Cycles
These are slow growing, interesting microbes that use nitrite and ammonia as inputs to generate energy. The nitrite + ammonia --> nitrogen gas (N2) + water. To achieve a significant population of Anammox organisms, requires fixed film reactors or very long sludge ages. To supply Anammox cultures with nitrite requires AOB converting ammonia into nitrite. The benefits of Anammox being avoiding the need to convert nitrite to nitrate (NOB) and then removing the nitrate via anoxic microbial activity.

    Author

    Erik Rumbaugh has been involved in biological waste treatment for over 20 years. He has worked with industrial and municipal wastewater  facilities to ensure optimal performance of their treatment systems. He is a founder of Aster Bio (www.asterbio.com) specializing in biological waste treatment.

    View my profile on LinkedIn

    RSS Feed

    Click to set custom HTML

    Archives

    December 2022
    November 2022
    October 2022
    September 2022
    August 2022
    June 2022
    May 2022
    March 2022
    February 2022
    January 2022
    November 2021
    October 2021
    September 2021
    August 2021
    June 2021
    April 2021
    March 2021
    February 2021
    December 2020
    November 2020
    October 2020
    September 2020
    August 2020
    July 2020
    June 2020
    May 2020
    April 2020
    March 2020
    February 2020
    January 2020
    December 2019
    November 2019
    October 2019
    September 2019
    August 2019
    July 2019
    June 2019
    May 2019
    April 2019
    March 2019
    February 2019
    January 2019
    December 2018
    November 2018
    October 2018
    September 2018
    August 2018
    July 2018
    June 2018
    May 2018
    April 2018
    March 2018
    February 2018
    January 2018
    December 2017
    November 2017
    October 2017
    September 2017
    August 2017
    July 2017
    June 2017
    May 2017
    April 2017
    March 2017
    February 2017
    January 2017
    December 2016
    November 2016
    October 2016
    September 2016
    August 2016
    July 2016
    June 2016
    May 2016
    April 2016
    March 2016
    February 2016
    January 2016
    December 2015
    November 2015
    October 2015
    September 2015
    August 2015
    July 2015
    June 2015
    May 2015
    April 2015
    March 2015
    February 2015
    January 2015
    December 2014
    November 2014
    October 2014
    September 2014
    August 2014
    July 2014
    June 2014
    May 2014
    April 2014
    March 2014
    February 2014

Proudly powered by Weebly
Photos used under Creative Commons from Picturepest, marcoverch, perzonseowebbyra, Picturepest, Picturepest, dsearls, dungodung, Massachusetts Office of Travel & Tourism, aqua.mech, vastateparksstaff, hile, Aaron Volkening, amishsteve, Neil DeMaster, mklwong88, KOMUnews, Picturepest, kaibara87