• Blog
  • Wastewater Testing
  • Bioaugmentation Applications
  • Useful Information
  • About Us
BIOLOGICAL WASTE TREATMENT EXPERT
Contact Us

How do you screen strains for use in bioaugmentation products?

10/28/2015

 
Picture
Creating an effective bioaugmentation product (bugs) for use in wastewater systems in a multiple step process that involves screening multiple candidates and creating a decision matrix before selecting the ideal candidate for inclusion into a formulation. We spend significant amounts of time characterizing strains for environmental growth conditions and degradation capabilities. Additionally, complexities arise when you make a product with both spore forming and vegetative strains. In fact, many companies limit their product to spore forming microbes even if that means losing an large amount of metabolic diversity.  Below, I have outlined the R&D process we use at Aster Bio (www.asterbio.com).
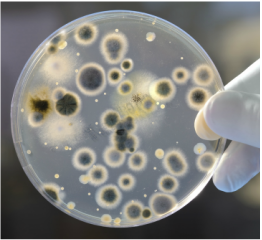
  • Isolate candidate microbes from environmental isolates, waste samples, or culture collections.
  • Screen to ensure the candidates are non-pathogenic and classified as Bio Safety Level 1 organisms.
  • Determine range of environmental conditions in which the strains grow. For example - pH, temperature, anaerobic growth, and nitrate/nitrite utilization.
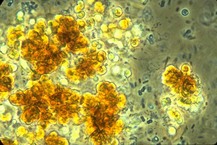
  • Growth on target organics and production of beneficial metabolites – this is where we see if it degrades problem compounds and forms desirable biofilm/floc. We aim to select the strains with best degradation capabilities and shortest-doubling time.
  • Investigate the strain ability to be grown in industrial fermentation processes.
  • Can the strain be preserved in shelf-stable forms. And conduct long term storage shelf life testing.
  • Testing to ensure compatibility with other strains in the consortia.
  • Lab testing on waste samples and compare growth to existing strains.
  • Field testing to ensure lab results holdup in the real world environment.
  • Introduce the new product.
As you can see, this process is not a quick process and can take over three years to go from a novel environmental isolate to a final product. 


Bacterial communication in biofilms is more advanced than though - and what this means to environmental biotechnology

10/26/2015

 
Picture
Researchers at University of California San Diego have found that bacteria in biofilms use ion channels to communicate with each other using electrical signals. This explains how a biofilm's outer cells slow growth and allow nutrients to reach the film's interior cells. In a biofilm, the exterior cells have access to nutrients but are exposed to potential toxic compounds and environmental hazards. Following a toxic event, the exterior cells that are severely damaged or dead are sloughed off creating turbidity and in big events increased effluent TSS. The undamaged cells inside the film rapidly replace the biopolymer matrix and reproduce to restore needed protection.

The research found that cells on the interior send electrical signals that reach the exterior cells via cell to cell signaling. The exterior cells slow reproduction and allow for transfer of nutrients to nurture growth inside the film. Remember biofilm is both found on fixed film (media systems) and suspended growth (as floc).

Residence time or treatment time in biological unit cannot be overlooked!

10/21/2015

 
Biological wastewater treatment relies on the underlying role of bacteria and other microbes as "nature's recycling system" as the microbes covert organics into ever smaller compounds and finally into carbon dioxide, water, and trace elements. It is this recycling role that we harness in waste treatment to rid wastewater of potentially toxic compounds that could impact downstream water health.

As discussed in earlier posts, the biological treatment unit provides an "ideal" environment to encourage microbial growth. The goal being to maintain a highly active, extremely concentrated population of microbes that can rapidly metabolize (treat) influent wastes. What can derail this treatment process?
  • Changes in influent makeup (an example being adding in a new waste stream that is different from existing influent)
  • Rapid increase in influent concentration
  • Mechanical issues with equipment
  • Hydraulic washout of biomass
  • Temperature extremes in unit (either above 42oC or below 12oC seem to be problem points)

This brings me to the most frustrating (to me at least) source of problems in waste treatment. Simply, the lack treatment time in the biological unit. No matter how much you coddle the microbes - providing excess D.O., nutrients, increasing recycle rates, etc. Biological treatment of organics, especially recalcitrant, toxic, quasi-toxic or xenobiotic compounds, takes prolonged exposure to microbes for the multiple steps in biological transformation to occur.

So if you have a high COD wastewater with only a 4 hour residence time in the biological unit, you will get a reducing in highly soluble, easily degradable compounds. The more complex and less bioavailable compounds simply pass through or are incompletely metabolized. Sometimes the metabolites from initial degradation can be more toxic than the initial compound.

How much time is needed? This is where you do lab based treatability testing before designing a waste treatment unit. If you must build a unit with 2 - 4 hour residence time for industrial wastes, (Yes I often see this) - do not expect real biological treatment no matter what you do. You can "contact stabilize" where microbes adsorb some organics for later biodegradation in a digester. But most likely, you will have a simple physical treatment unit that aerates/mixes the influent only.

What are the primary factors impacting biological treatment efficiency?

10/19/2015

 
Biological waste treatment units are designed to provide an environment that promotes rapid microbial growth and metabolism. Our job in running the system is to ensure we provide the best possible growth environment, but what constitutes the ideal growth environment? I have a standard list that includes the following:

Aerobic Systems
  • Dissolved Oxygen (DO)
  • Temperature
  • pH
  • Alkalinity
  • Ammonia
  • Total Nitrogen (TKN)
  • Phosphorus (ortho & total)
  • COD/BOD/TOC (measure of organic loading concentration)
  • Influent makeup (look at ease of biodegradation or potential toxicity)
  • Metals (especially heavy metals)
  • Chlorides or salinity
  • Residence time in biological unit
  • Biological solids in the unit (MLSS/MLVSS)
  • Sludge age (days)
  • Position on growth curve (determined by microscopic exam and oxygen uptake rates)

Anaerobic/Anoxic Systems
  • Redox potential (mV)
  • pH
  • Tempreature
  • Alkalinity
  • Methane in off gas - if available
  • Carbon dioxide in off gas- if available
  • COD/BOD/TOC (loading)
  • Residence time
  • Metals
  • Influent makeup (look for difficult or toxic compounds)
  • Biological solids
  • Ammonia & nitrogen in/out - (ammonium, nitrite, nitrate, TKN)
  • Phosphorus in/out
  • Trace micronutrients (if methane production is unexpectedly low)

Using a concentrated Nitrosomonas culture for rapid determination of wastewater toxicity

10/7/2015

 
I often get questions regarding the potential impact of new waste stream on the biological treatment unit. After looking at reference materials on the compounds, we often do direct toxicity testing. The first test looks for inhibition of heterotrophic microbes. I prefer to use PolyTox test kits here. A quick 20-minute test that requires only a BOD bottle, stir plate, and BOD probe/meter; the PolyTox test used a known standardized biomass with the data being reduced oxygen uptake due to immediate inhibition.

Often the concern is the potential impact on ammonia oxidizing bacteria (AOB), which are much more sensitive and slower growing than heterotrophic microbes. Many compounds are highly toxic to ammonia oxidizing cultures including:
  • Heavy metals (Cu, Co, Pb, etc.)
  • Cyanides/Cyanates
  • Phenols
  • Mercaptans
  • Thiourea
  • Aniline
  • Certain Halogenated Compounds
 
In order to determine the potential impact on ammonia removal, we can do a simulation using a concentrated Nitrosomonas culture. There are three basic toxicity screening tests we can do using a syringe of Nitrosomonas cell paste.
  1. Dilute new stream to see immediate untreated toxicity to culture
  2. Simulate treatment with existing heterotrophic cultures in a shake flask simulation. Then test with the Nitrosomonas procedure.
  3. Test the whole effluent toxicity using Nitrosomonas as a proxy for acute toxicity higher life forms such as ceriodaphia dubia. This requires correlating AOB inhibition to acute and chronic toxicity testing by running samples during the same period.
The test requires the use of flasks, aquarium air stones, tris buffer (ensures proper pH), and an ammonia ion selective probe (or other ammonia test). The process includes setting up dilutions of the sample and a control with buffered DI water and ammonium chloride. To all flasks, we add a 10 ml cell concentrate of AOB to ensure the sample is not biomass limited with respect to AOB. After taking initial ammonia readings, the flasks are aerated and maintained at 30oC temperature if a water bath is available. Otherwise, we perform the test at ambient lab temperature. Take ammonia readings every 30 minutes and plot the test flasks versus the control. Once ammonia drops below 5 mg/L, end testing.

F/M Ratio - Targets & Why this should not be the only operational control

10/2/2015

 
Recently I have been participating in an online discussion about Food/Microorganism (F/M) targets for a dairy wastewater treatment plant. The engineer wanted to know the target F/M ratio for dairy wastewater. Often I get this question with little supporting information such as: original system design and treatment targets.

When asked about F/M most consultants and engineers open a standard engineering text and give an answer from standard design numbers. I often will give a number from Metccalf & Eddy but indicate that this is just a starting point and influent makeup, temperature, pH, treatment targets, and a big "other factors" can require modifications on the number.  For your reference here are a few of the target numbers:
  • Coventional AS Plug Flow - 0.2 - 0.4 (kg BOD/kg MLVSS*d)
  • Complete Mix - 0.2 - 0.6
  • Extended Aeration - 0.04 - 0.1 (this being the most common in industrial & food processing)
I would like to emphasize that the above values are a starting point for operating decisions. You should always look at design parameters and even similar wastewater installations if possible.

In the dairy case that I first mentioned, I suggested that they look at their current F/M and check SV30, microscopic exam, and oxygen uptake rates to get a full picture of the system's biological state.

The easiest to interpret may be the microscopic exam. Use the following chart to determine how indicator protozoa, floc formation, and F/M relate. Note extended aeration operated at the far right side of the ideal F/M ratio section - this uses a lower F/M and higher mean cell residence time (MCRT) to both reduce solids yield and nutrient (N,P) control in systems with nutrient permits.


Picture
http://waterfacts.net/Formulas/F-M_Ratio/f-m_ratio.html

    Author

    Erik Rumbaugh has been involved in biological waste treatment for over 20 years. He has worked with industrial and municipal wastewater  facilities to ensure optimal performance of their treatment systems. He is a founder of Aster Bio (www.asterbio.com) specializing in biological waste treatment.

    View my profile on LinkedIn

    RSS Feed

    Click to set custom HTML

    Archives

    December 2022
    November 2022
    October 2022
    September 2022
    August 2022
    June 2022
    May 2022
    March 2022
    February 2022
    January 2022
    November 2021
    October 2021
    September 2021
    August 2021
    June 2021
    April 2021
    March 2021
    February 2021
    December 2020
    November 2020
    October 2020
    September 2020
    August 2020
    July 2020
    June 2020
    May 2020
    April 2020
    March 2020
    February 2020
    January 2020
    December 2019
    November 2019
    October 2019
    September 2019
    August 2019
    July 2019
    June 2019
    May 2019
    April 2019
    March 2019
    February 2019
    January 2019
    December 2018
    November 2018
    October 2018
    September 2018
    August 2018
    July 2018
    June 2018
    May 2018
    April 2018
    March 2018
    February 2018
    January 2018
    December 2017
    November 2017
    October 2017
    September 2017
    August 2017
    July 2017
    June 2017
    May 2017
    April 2017
    March 2017
    February 2017
    January 2017
    December 2016
    November 2016
    October 2016
    September 2016
    August 2016
    July 2016
    June 2016
    May 2016
    April 2016
    March 2016
    February 2016
    January 2016
    December 2015
    November 2015
    October 2015
    September 2015
    August 2015
    July 2015
    June 2015
    May 2015
    April 2015
    March 2015
    February 2015
    January 2015
    December 2014
    November 2014
    October 2014
    September 2014
    August 2014
    July 2014
    June 2014
    May 2014
    April 2014
    March 2014
    February 2014

Proudly powered by Weebly
Photos used under Creative Commons from Picturepest, marcoverch, perzonseowebbyra, Picturepest, Picturepest, dsearls, dungodung, Massachusetts Office of Travel & Tourism, aqua.mech, vastateparksstaff, hile, Aaron Volkening, amishsteve, Neil DeMaster, mklwong88, KOMUnews, Picturepest, kaibara87