• Blog
  • Wastewater Testing
  • Bioaugmentation Applications
  • Useful Information
  • About Us
BIOLOGICAL WASTE TREATMENT EXPERT
Contact Us

November 25th, 2019

11/25/2019

 
Picture
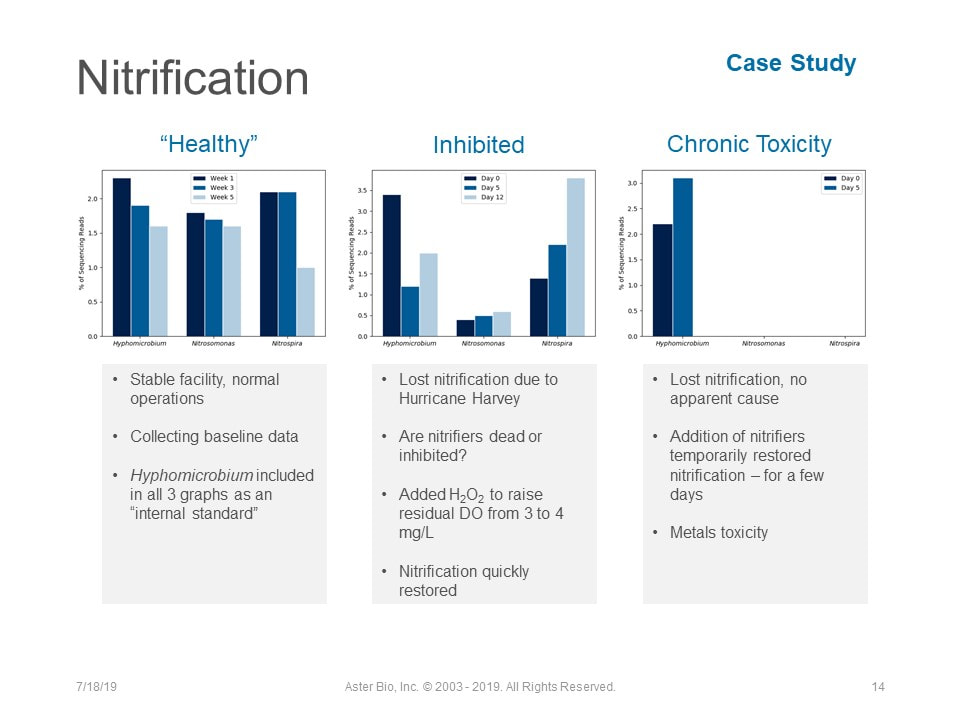
Examples of how molecular testing an track nitrifier populations.
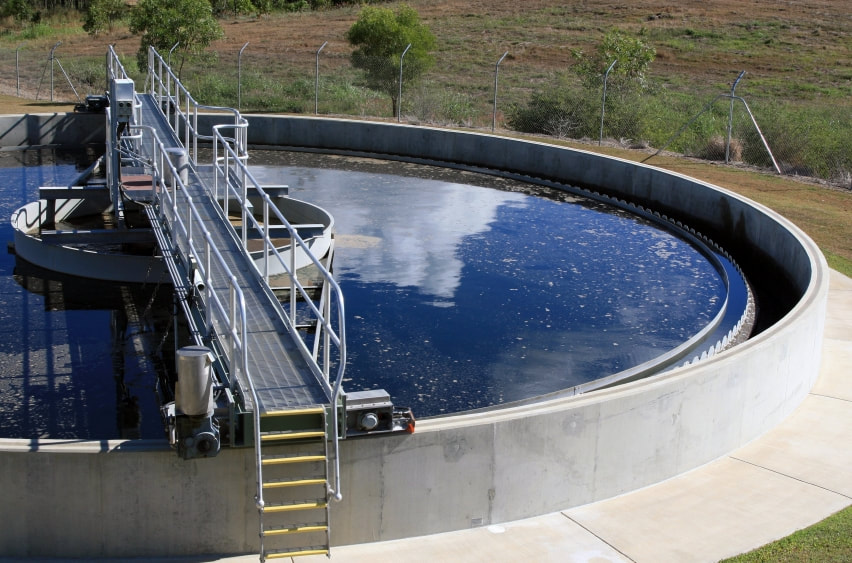
Among the slowest growing organisms in your wastewater treatment plant, nitrifiers (AOB/NOB) are also picky about pH, dissolved oxygen, and inhibited by many compounds often present in wastewater. Since you need nitrifiers to efficiently remove ammonia and nitrite above the amount used by cells for growth on influent organics, keeping a stable nitrifier population is often a challenge. So what should you do when effluent ammonia increases - indicating a loss of nitrifeir activity? Instead of immediately reaching for a commercial nitrifier product ,  I suggest doing the following:
  • Find out why you lost nitrification. A previously stable nitrifier population, just doesn't get up and leave. You had a gradual loss of nitrifiers in the system or some type of shock that caused a rapid drop in populations. Find out what happened and then evaluate control options.
  • Run influent Total Nitrogen (TKN), ammonia, amines to discover how much nitrogen is entering that needs to be oxidized.
  • If you have a history of nitrifier loss, you can use qPCR and MCA to track AOB/NOB populations. Molecular testing will show population changes well before effluent ammonia increases. I have found molecular testing effective in adjusting MCRT, F/M, and identifying chronic toxicity to nitrifiers.
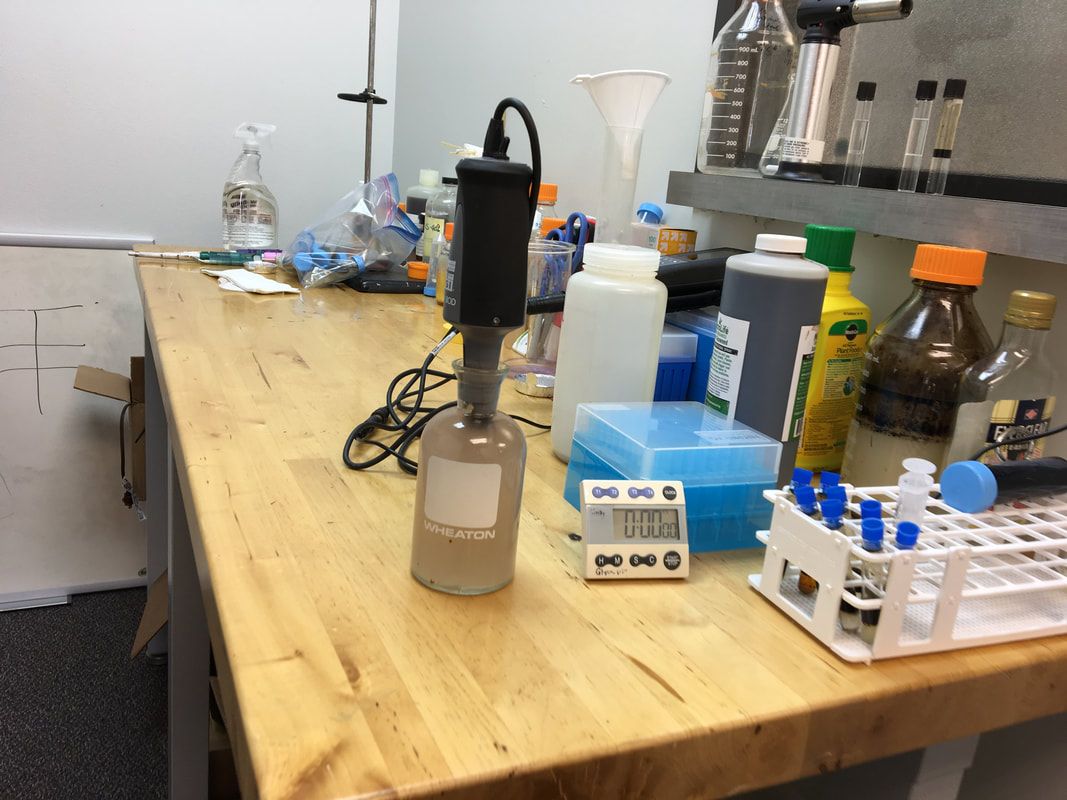
  • Run an acute nitrifier toxicity test if you cannot find reasons for the loss in activity or suspect influent inhibition. Acute testing involves using a concentrated nitrifier culture in a 2 - 3 hour test to determine % inhibition of AOB activity. 
  • After you correct the situation and get an environment suitable for nitrifier growth, they will eventually grow back to needed levels. However, this can take longer than is acceptable. Nitrifier recovery time can be reduced by adding commercial nitrifiers. These nitrifier concentrates require refrigeration and have a very short-shelf life, so consider logistics when preparing to use the cultures. Also, make sure that you have the system in the best shape possible for promoting nitrifier growth.
If you have any questions on the testing mentioned above or commecial nitrifier options, drop me an email or message. The best strategy is not to lose nitrifiers and monitor their populations closely.

Why lab testing biodegradability of difficult compounds does not do a good job of predicting what happens in the real environment

11/20/2019

 
Picture
There is a lot of discussion on micropollutants such as pharmaceuticals, chlorinated organics, pesticides/herbicides, and even common things such as artificial sweeteners. The biggest issues are these xenobiotics (not naturally occurring compounds) are passing through biological treatment without degradation. So, a lot of effort is being directed at finding bacteria that can degrade these compounds. In traditional microbiology, we pften screen organisms by sole-carbon source testing. In sole-carbon source testing, you look for microbes that can initate biodegradation of the target compound. Often we can find strains that grow on the target compound. For more difficult compounds, we may need to a cometabolism component. If organisms exist that can degrade these compounds, why are the difficult to treat in wastewater, soils, and groundwater? Here are a few possible explanations:
​
  • The most discussed reason is that ​target concentrations are too low for supporting the organisms. At concentrations in the ppb (parts per billion), there is often too little of the compound for direct degradation. In this case you need to evaluate cometabolism where a non-specific enzyme starts decomposition.

  • Another cause could be that moving from a sole-carbon source environment to one with other available "energy" sources will change microbial behavior. In the presence of easy-to-degrade substrates (sugars, starches, etc), we often see microbes conusmer the "easy" compounds first. This leaves low energy yeilding compounds unaltered. Think of this as similar to giving kids a choice of candy or broccoli. Which one would most kids select... of course you know it is candy. 

About Oxygen Uptake Rates (OUR) and what those numbers mean

11/18/2019

 
Picture
OUR test in progress.
Oxygen Uptake Rate (OUR or sometimes DOUR) uses a dissolved oxygen probe with a BOD bottle to measure oxygen uptake by biomass. While you could purchase a highly automated, advanced respirometer, for wastewater operations we can do just fine with a standard BOD probe and bottle setup. 

Aerobic wastewater treatment microbes consue oxygen when growing. When you saturate a sample with oxygen and then cap the bottle with a DO probe, you measure the oxygen consumed by the bacteria. The observed oxygen uptake per minute gives your the OUR number. Here is a OUR test protocol - https://www.biologicalwasteexpert.com/useful-information.html.

Few bullet points on OUR/SOUR and what the numbers mean for operations.
  • OUR should be run frequently to get a baseline normal rate. This is very important, your normal OUR is specific to your system and MLSS concentrations. Using similar systems or rules-of-thumb are just not as good.
  • Make sure you calibrate your DO meter & probe - sometimes we get in a rush and don't check. This is where mistakes happen.
  • ​Higher respiration rates indicate more soluble organics (higher BOD5)
  • Low OUR indicates soluble BOD has been substantially removed and biomass is entering endogenous respiration. 
  • If the DO drops below 1 mg/L - the meter is not as accurate. Make sure you calculate based on DO from saturation down to a minimum of 1 mg/L.
  • For industrial waters, if you see a very low OUR & have normal/high COD influent - you may have toxicity. Be sure to check for changes in influent. Be aware of suddenly low OUR numbers.
  • If you change MLSS concentrations, convert OUR to SOUR which is OUR divided by MLSS (grams). Make sure you do the calculations the same every day - don't switch between MLSS and MLVSS for calculating SOUR.

Denitrification in secondary clarifiers

11/14/2019

 
Picture
Denitrifcation happens when bacteria begin to use nitrate and nitrite as an alternative electron acceptor. This a complex way to say that the bacteria are using the oxygen in nitrate and nitrite, leaving nitrogen gas. If you get denitrification in a treatment basin, it is a good sign and often required for facilities with nitrite/nitrate discharge limits. If you have denitrification in a secondary clarifier, you can have floating solids with TSS carryover into the effluent. So what can you do to prevent denitrification in secondary clarifiers:
  • Control bed depths to between 2 - 3 feet by adjusting recycle rates
  • Hydraulic residence time in clarifier 2 - 4 hours
  • Warm temperatures increase denitrification (high metabolic activity) so problem is usually more pronounced in summer months
  • Use a water spray to degas the floating solids - you will see the bubbles breakout and the sludge sink

Biofilm based wastewater treatment

11/5/2019

 
Picture
Biofilm on MBBR media.
I still like and am fascinated by trickling filter wastewater treatment systems. A simple trickling filter is a tank or tower packed with media on which biofilm grows. Trickling filter biofilm is just like the biofilms you find on Rotating Biological Contact (RBC), MBBR, and any type system where you have a support matrix for biofilm growth.

In an old tricking filter, you can see how biomass develops as the wastewater moves through the media. Early stages have heterotrophic bacteria that remove soluble BOD. Protozoa in highly loaded sections favors amoeba and flagellates. As souble BOD drops and oxgyen increases, you start to see develoment of higher indicator protozoa and appearance of slower growing bacteria such as nitrifiers and sulfur oxidizers. 

Pros of Biofilm Systems
  • ​Can support more biomass than suspended growth systems in a given tank/clarifieSor configuration
  • Effective for allowing slow growing organisms such as nitrifiers to develop
  • Biofilm offers some protection against hydraulic stress (washout) and limited toxic shock (pH, inhibitory chemicals)
  • Less operator action required than suspended growth
  • Effective for pre-treatment of high strength waste (roughing filters)
    ​
Cons of Biofilms Systems​
  • ​Can be fouled by Fats, Oils, Grease (FOG) - high FOG can "coat" the biofilm
  • Less ability to change operations (MCRT, F/M) than suspended growth 
  • Favors filmentout forms that can be difficult to remove with gravity solids separation


Soluble BOD5 vs ultimate BOD20

11/1/2019

 
PictureBOD bottle. Source: Wikimedia commons.
We don't often get back to an old test such as BOD very often. However, I have seen posts where people are seeing BOD5 removal drop and they are wondering why their treatment systems is running well, yet effluent BOD is high.

BOD5 is also called soluble BOD. This means that BOD5 represents oxygen demand by most common wastewater components such as sugars, fatty acids, starches, etc. What remains in the BOD5 bottle after 5 days tends to be insoluble or recalcitrant organic compounds. This could be particulates, FOG, long chain hydrocarbons, xenobiotics, pharmaceuticals, lignin, and other slow to degrade or insoluble organics. In theory, if we continued to run the BOD test for 20 days, the microbes would continue to consume oxygen (although at a slower rate) as they degraded these compounds. 

The BOD20 vs BOD5 can be related to BOD5 removal efficiency by considering how non-soluble or recalcitrant compounds are processed by  microbes. For example, consider grease (a very common insoluble in wastewater). If you do not remove grease in pretreatment, the following happens in the biological unit:
  • Option 1 - the grease can float across treatment system straight to the effluent
  • Option 2 - insoluble grease is adsorbed (fixes) into the MLSS - this can also lead too floating scum on the clarifier.
Now we will assume tht the grease is adsorbed into floc. As the soluble BOD decreases, the bacteria begin to use a combination of biosurfactants & exocellular enzymes to carve up the long chain hydrocarbon into forms capable of being transported across the cell wall. In the case of long chain fatty acids (FOG), biodegradation takes place via Beta-Oxidation where fatty acid length is decreased two carbons each cycle through the beta-oxidation pathway. Once the fatty acid drops to less than 10 carbons in length, solubility increases and degradation rates increase as you have converted the organic into soluble BOD. This is how microbes can increase the soluble BOD5 while degrading organics that were previously not detected by the 5 day test.

​Now back to case of BOD5 being possibly generated across a aeration basin. If you expect potential conversion of insoluble organics into soluble (BOD5) forms across your biological unit, you an check by running COD or filtered COD. Besides being a quick test, COD is effective in rapid detection of things contributing to ultimate BOD. 

    Author

    Erik Rumbaugh has been involved in biological waste treatment for over 20 years. He has worked with industrial and municipal wastewater  facilities to ensure optimal performance of their treatment systems. He is a founder of Aster Bio (www.asterbio.com) specializing in biological waste treatment.

    View my profile on LinkedIn

    RSS Feed

    Click to set custom HTML

    Archives

    December 2022
    November 2022
    October 2022
    September 2022
    August 2022
    June 2022
    May 2022
    March 2022
    February 2022
    January 2022
    November 2021
    October 2021
    September 2021
    August 2021
    June 2021
    April 2021
    March 2021
    February 2021
    December 2020
    November 2020
    October 2020
    September 2020
    August 2020
    July 2020
    June 2020
    May 2020
    April 2020
    March 2020
    February 2020
    January 2020
    December 2019
    November 2019
    October 2019
    September 2019
    August 2019
    July 2019
    June 2019
    May 2019
    April 2019
    March 2019
    February 2019
    January 2019
    December 2018
    November 2018
    October 2018
    September 2018
    August 2018
    July 2018
    June 2018
    May 2018
    April 2018
    March 2018
    February 2018
    January 2018
    December 2017
    November 2017
    October 2017
    September 2017
    August 2017
    July 2017
    June 2017
    May 2017
    April 2017
    March 2017
    February 2017
    January 2017
    December 2016
    November 2016
    October 2016
    September 2016
    August 2016
    July 2016
    June 2016
    May 2016
    April 2016
    March 2016
    February 2016
    January 2016
    December 2015
    November 2015
    October 2015
    September 2015
    August 2015
    July 2015
    June 2015
    May 2015
    April 2015
    March 2015
    February 2015
    January 2015
    December 2014
    November 2014
    October 2014
    September 2014
    August 2014
    July 2014
    June 2014
    May 2014
    April 2014
    March 2014
    February 2014

Proudly powered by Weebly
Photos used under Creative Commons from Picturepest, marcoverch, perzonseowebbyra, Picturepest, Picturepest, dsearls, dungodung, Massachusetts Office of Travel & Tourism, aqua.mech, vastateparksstaff, hile, Aaron Volkening, amishsteve, Neil DeMaster, mklwong88, KOMUnews, Picturepest, kaibara87