• Blog
  • Wastewater Testing
  • Bioaugmentation Applications
  • Useful Information
  • About Us
BIOLOGICAL WASTE TREATMENT EXPERT
Contact Us

Maintaining nitrifier populations in biological treatment units & when commercial nitrifier concentrates are useful

3/30/2022

 
Picture
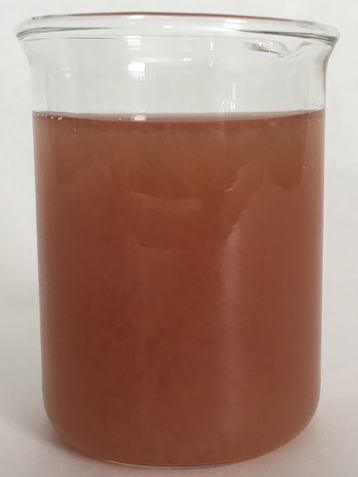
AOB/NOB cultures from nitrifier reactor

Everyone knows that AOB & NOB cultures are among the slowest growing cultures in WW treatment plants.  Upsets of any kind may result in effluent ammonia breakthrough.  If your system has an MCRT lower than the washout or wasting rate, the. % nitrifiers in the biomass will decrease and eventually you will see increased effluent ammonia.  The key is to understand AOB & NOB growth rates and how you can try to keep them at their maximum rates while also managing all other biological unit processes.

I often get calls about a system where everything is fine - great COD removal and settling - except the nitrifiers are either dead or not working.  Here is the process for walking through the nitrifier problem without wasting operation budgets.  


First, if you lost nitrification don’t just blindly throw expensive nitrified concentrates at the problem!  
(1) Identify what happened in order of likelihood - you will often see multiple factors
  • Higher influent TKN or ammonia - yes, both are needed
  • Look at influent organic loadings (COD or BOD)
  • Changes in MCRT, F/M, pH, Temperature, D.O., alkalinity
  • Toxicity - phenol, sulfides, cyanides (Not as common as everyone thinks)

(2) Determine if you have really lost your AOB/NOB population by running a qPCR nitrifier panel.  Fast, low cost and gives quantitative numbers for both AOB & NOB. Make sure the qPCR primer library is based on actual wastewater AOB/NOB testing.

(3) Depending upon qPCR results, you select options
  • Provide ideal conditions for growing indigenous AOB/NOB populations. If you have inhibitory compounds or higher than normal COD/BOD, we need to optimize the heterotrophic population and improve conditions to allow for full AOB/NOB activity.
  • To speed the natural recovery process, adding nitrifiers may be recommended.  AOB/NOB concentrates are still slow growing chemotrophs just like indigenous nitrifiers.  Dose is based on how much ammonia needs to be oxidized, how long recovery time is available, and expected growth rate for the cultures.  AOB max growth rate is usually 12 hours vs 1 - 2 hours for heterotrophs.

(4) The key is don’t lose your AOB/NOB populations.  Don’t wait for effluent ammonia to increase!.  For systems with a history of nitrification issues, run qPCR checks on a routine basis to discover normal populations.  If you see a decrease, take actions to improve the environment for your nitrifiers.

Use the growth curve when doing microscopic exams….. it is not just about the cool protozoa!

3/23/2022

 
Picture
We all know that microscopic exam tells you a lot about wastewater system microbiological health.  Even older microscopes, without phase contrast, allow for observation of protozoa and metazoa.  Both protozoa and metazoa are known as indicator organisms as different morphological types appear based on D.O., soluble BOD, and freedom from inhibitory compounds.  

In performing a daily microscopic exam, I like to see operators noting the following:
  • Note floc size and density.  While phase contrast helps to see filaments, you can also see filaments with regular light microscopy.  You do not need to do full filament ID with staining here.  Just note floc and filaments that you see and compare your observations with SV30/SVI, turbidity, and other system data.
  • Note protozoa present - you do not have to identify down to genus level! Just note amoeba, flagellates, free-swimming ciliates, crawling ciliates, and stalk ciliates. These are morphological types which only require quick observation.  Also note multi-cellular organisms if present.  

Now that you have the observations, you can note where the system is on the growth curve.  Remember, most system are designed to function best in the early stages of decline phase growth. This region of the growth curve gives low soluble BOD5, efficient nitrification, and good floc formation - all good things. 

While the bug chart says you will see a biomass dominated by stalk ciliates, crawling ciliates, and some metazoa, you may have system specific differences.  This is why you want to perform frequent microscopic exams on your system to know how a good, normal indicator organism population looks.  If you see changes in the population, you can look for movement along the growth curve towards "young sludge" or "old sludge" and make operational changes as needed.

Bugs behaving badly - when good bugs go bad

3/16/2022

 
Picture
Sometimes a normal vital MLSS organism can exhibit behaviors that we don't want.  From forming "Zoogleal" EPS to building sheathed filaments, these organisms respond to environmental factors and do things that we don't want in a treatment system.  From a science standpoint, this is a discussion of phenotype (what you see) vs genotype (what DNA is present).  However, we are increasingly able to predict what causes this bad behavior and can take corrective actions.

Example 1 - Zoogleal (Non-filamentous) bulking
In typical activated sludge and decline phase growth systems, often Zooglea type organisms are the most common genera found when looking at DNA.  In addition to degrading many organic components of BOD5, these organisms are also great for denitrification and making EPS needed for floc/biofilm formation.  Problems come when high Zooglea (or Thauera) populations meet conditions that cause excess EPS production.  Example triggers include:
  • high soluble BOD5 (they store soluble BOD as EPS)
  • Low N or P which slows cell metabolism - resulting in organics being stored in EPS

Example 2 - Sphaerotilus natans
A common sheathed filament, S. natans can often be seen in filamentous bulking sludges. Under normal conditions with sufficient D.O., S. natans grows as a typical floc forming organisms. In response to stress of low D.O., we see the formation of the sheath and filamentous growth.  

Can bacteria do calculus?  Yes, they can!

3/9/2022

 
Picture
Source: www.clipart-library.com
While the mathematics behind calculus can be complex, in nature we see organisms "taking the easy path" that yields the most energy.  This process of dynamic optimization can be described using mathematics. Fortunately for wastewater treatment, we just need to understand the concepts to predict what is going to happen.

Like children given broccoli or candy at Halloween, bacteria prefer to grow on the "tasty" compounds first.  In this case, heterotrophic organisms grow fastest on soluble compounds with glucose often being the "ideal" energy source.  The key concept here is - net energy yield!  Cells have to produce enzymes and undertake other biochemical processes all of which take energy when growing.  These enzymes and biochemicals transform organics into simple compounds that fuel cellular machinery and yield energy.

Here are a few general rules of bacteria calculus:
  • Simple soluble organic compounds are degraded first.  Tells why insoluble FOG tends to accumulate.
  • Aerobic processes yield more cellular energy than anaerobic.
  • While complex organics such as lignin or Polynuclear Aromatics Hydrocarbons (PAH) are biodegradable, the bacteria using these compounds much be either slow growing niche organisms or have exhausted the "easy" energy sources
  • AOB/NOB (nitrifiers) are among the chemotrophic organisms that occupy a niche - they may have some other pathways, but most of their energy comes from oxidation of ammonia and nitrite.  This has lower energy yield than most organics, so AOB & NOB have lower growth rates.

So how do you use bacterial calculus to predict behavior in wastewater?
  • High energy reactions will happen first.  As energy sources are exhausted, the population will shift to other energy sources.
  • Low F/M - means that you are forcing the bacteria to work on the lower energy reactions sooner than would be in a high F/M system.
  • Low F/M - means that niche organisms have more of a chance to acquire macronutrients and other growth factors as competition with fast growing organisms is reduced.

    Author

    Erik Rumbaugh has been involved in biological waste treatment for over 20 years. He has worked with industrial and municipal wastewater  facilities to ensure optimal performance of their treatment systems. He is a founder of Aster Bio (www.asterbio.com) specializing in biological waste treatment.

    View my profile on LinkedIn

    RSS Feed

    Click to set custom HTML

    Archives

    December 2022
    November 2022
    October 2022
    September 2022
    August 2022
    June 2022
    May 2022
    March 2022
    February 2022
    January 2022
    November 2021
    October 2021
    September 2021
    August 2021
    June 2021
    April 2021
    March 2021
    February 2021
    December 2020
    November 2020
    October 2020
    September 2020
    August 2020
    July 2020
    June 2020
    May 2020
    April 2020
    March 2020
    February 2020
    January 2020
    December 2019
    November 2019
    October 2019
    September 2019
    August 2019
    July 2019
    June 2019
    May 2019
    April 2019
    March 2019
    February 2019
    January 2019
    December 2018
    November 2018
    October 2018
    September 2018
    August 2018
    July 2018
    June 2018
    May 2018
    April 2018
    March 2018
    February 2018
    January 2018
    December 2017
    November 2017
    October 2017
    September 2017
    August 2017
    July 2017
    June 2017
    May 2017
    April 2017
    March 2017
    February 2017
    January 2017
    December 2016
    November 2016
    October 2016
    September 2016
    August 2016
    July 2016
    June 2016
    May 2016
    April 2016
    March 2016
    February 2016
    January 2016
    December 2015
    November 2015
    October 2015
    September 2015
    August 2015
    July 2015
    June 2015
    May 2015
    April 2015
    March 2015
    February 2015
    January 2015
    December 2014
    November 2014
    October 2014
    September 2014
    August 2014
    July 2014
    June 2014
    May 2014
    April 2014
    March 2014
    February 2014

Proudly powered by Weebly
Photos used under Creative Commons from Picturepest, marcoverch, perzonseowebbyra, Picturepest, Picturepest, dsearls, dungodung, Massachusetts Office of Travel & Tourism, aqua.mech, vastateparksstaff, hile, Aaron Volkening, amishsteve, Neil DeMaster, mklwong88, KOMUnews, Picturepest, kaibara87