• Blog
  • Wastewater Testing
  • Bioaugmentation Applications
  • Useful Information
  • About Us
BIOLOGICAL WASTE TREATMENT EXPERT
Contact Us

Walking through MLSS & MLVSS testing

10/29/2018

 
Picture
I have received several questions on MLSS & MLVSS testing and how to calculate volatiles vs non-volatile fractions. Instead of regurgitating formulas, I will walk through the test calculations the way I remember the math.
  • MLSS & TSS are the same thing. Both measure total solids in a liquid sample. TSS usually refers to effluent solids, where MLSS is usually solids in the aeration basin.
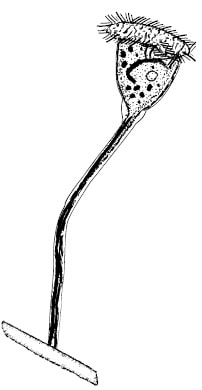
  • First weigh the filter to get baseline weight. Make sure the filter is dry!
  • MLSS is the total solids. What we do is dry in an oven at 105 Deg C for at least 1 hour - this evaporates the water in the sample leaving dried contents of the sample. 
  • After calculating the MLSS, you put the same filter in the 550 Deg C furnace for 30 minutes. At 550 Deg C, you flash off the volatile organic fraction leaving inorganic portion of the MLSS. When you weigh the cooled filter, you obtain the weight of non-volatile solids.
  • For calculating the volatile solids or MLVSS, you take the MLSS number - the non-volatile solids (last step). This gives you the MLVSS.
  • When calculating F/M you can use either MLSS or MLVSS - just make sure you are consistent.

Wastewater toxicity - using discovery & analytical to identify causality

10/23/2018

 
Picture
Many of us in industrial wastewater have experienced a toxic shock event. In most cases, toxic shock is noted by loss of nitrification and deflocculation (turbidity/floating solids). Today, I will work thorough my process for identifying what caused or is causing the upset. 
  1. Remember "toxicity" is not a thing - you must identify what caused loss of biological activity and steps to prevent it in the future.
  2. Do not accept that "nothing changed" - something did change as evidenced by change in biomass activity.
  3. Look into influent and process flows - instead of running random outside lab tests, identify most likely candidates for upset. This is a thinking exercise - look at past events or operator notes.
  4. After identifying potential bad actors, you can start analytical testing. We have options tailored to specific industries. For example, Aster Bio uses a battery of petrochemical wastewater tests to identify levels of common bad actors in refinery wastewater. Using GC/MS and analytical tests, we can identify and quantify many "bad actors".
  5. Fixing the problem - since we cannot hold back water for extended periods, we usually use slowing forward flows, diversion of high strength wastes, additional oxygen, and bioaugmentation (or bugs). Note that the response includes multiple activities - this is where consultants can help bring new technologies or thought processes.
  6. After fixing and identifying the cause - develop monitoring and early warning abilities to meet the problem flows before acute toxicity. We can use many tools from step 5 above to prevent a major biological unit upset.

What are you really looking at when doing a microscopic exam?

10/18/2018

 
PictureStalk Ciliate - an ideal protozoa indicator
I like it when a facility looks under the microscope daily. Even if you do not have a high dollar phase contrast microscope, you can make valuable observations with they standard light microscope that is common to many high school classrooms. But what are you looking at when you observe samples at 100x, 400x, and even 1000x magnification? Today, I'll cover what you see when using a microscope.

First, the "bugs" we note using the microscope are mostly single celled protozoa and a few multicellular lifeforms. The bacteria - or the actual workers - can be seen as part of the floc or as very, very small particles in the water. Some bacteria can become filamentous in form or are large enough to be seen with microscope, but most even at 1000x appear as small rods or spheres. 

We rely on the protozoa and higher life forms as indicator organisms for the underlying bacteria populations. For example, stalk ciliates are only present and active when there is sufficient dissolved oxygen and low levels of inhibitory or toxic compounds. This just happens to be where we are in decline phase growth or target F/M for most wastewater treatment plants. Multicellular forms such as rotifers, worms, or tardigrades appear even further along the F/M curve and can indicate old sludge or too low an F/M where you are carrying too much dead or inactive biomass.

I recommend looking under the microscope daily for the following:
  • Floc size & density
  • Filaments if present and estimate their relative abundance
  • Protozoa present and in what abundance
  • Multicellular life forms and abundance
    ​
Next Generation Technology for Biomass Monitoring
While I use the microscopic exam daily, I also like to run newer molecular testing that looks directly into the floc's microbial community. With high throughput sequencing, we look at DNA in the system and find our which microbes are present and at what % of total biomass reads (identifying DNA segments). This is a total microbial census of the MLSS and is good to run when establishing a baseline population database, making operational changes or on a quarterly basis for tracking long term changes. Following Microbial Community Analysis (MCA), we identify key microbes that are most important for good treatment. We can then use qPCR technology to track these specific microbes. qPCR is faster, highly quantitative, and cheaper than the full microbial census (MCA). 


Oxygen uptake rates (OUR & DOUR) as a wastewater monitoring parameter

10/15/2018

 
Picture
Using an optical DO probe setup from YSI Corporation.
Microbes consume dissolved oxygen (DO) when growing on wastewater pollutants.  The rate at which the microbes consumer oxygen is the respiration rate. During periods of high loadings the respiration rates increases as the microbes become more active and cellular division rates increase.

OUR rates increase in response to higher soluble organic loadings  (BOD5), faster microbial division (low F/M), and following upset conditions when microbes are moving back towards stable population - this is log phase growth.

Another facet of OUR testing includes a potential for a drop in respiration rates due to acute toxicity where previously respiring microbes are inactivated (killed). I have seen this with phenol, cyanide, and tall oil releases in industrial wastewater. 

So any large change in OUR rates should be investigated. If you are changing MLSS concentrations, you should standardize the OUR by using the SOUR calculation (divide OUR by MLSS or MLVSS in grams).

Here is a link to the OUR test protocol that I have used for the past 25 years. 
​
317534197-dour-sour-protocol.pdf
File Size: 361 kb
File Type: pdf
Download File

The Sulfur Cycle in Wastewater Systems

10/8/2018

 
Being both deadly in enclosed spaces and a nuisance at even low levels, hydrogen sulfide is among the most problematic of compounds in wastewater treatment. Instead of covering the whole geochemical sulfur cycle, I want to look into the wastewater specific cycle that converts benign sulfates and sulfur into the problematic reduced sulfide species. Instead of graphics, I want to detail each form of sulfur found in wastewater.
  • Sulfate - one of the most common forms of sulfur found in the environment. Sulfate is used by plants and is an important micronutrient for life.
  • Sulfur - the yellow powder or rock form of sulfur. 
  • Reduced Sulfides - often seen as S= or in analytical tests as Total Reduce Sulfides. This form of sulfide can bind with iron and give the dark gray to black color seen in septic wastewater. Sulfides are more soluble in water with a higher pH. Reduced sulfides in wastewater have a high chemical oxygen demand and are toxic to Ammonia Oxidizing Bacteria (AOB) that are required for ammonia removal.
  • Hydrogen Sulfide - a corrosive, highly toxic gas, H2S is released from water into the atmosphere as pH drops in wastewater. (This is why one of the collection system odor control methods is to increase sewer line pH).

Now for the microbes involved in wastewater sulfur cycles:
  • Sulfate Reducing Bacteria - these bacteria under anoxic conditions use sulfate as electron acceptor to degrade organics. If you have oxygen or nitrate in the system, sulfate reducing bacteria are outcompeted by harmless bacteria that obtain more energy using oxygen or nitrate as an electron acceptor.
  • Sulfur Reducing Bacteria - these chemotrophic bacteria obtain energy by reducing sulfur into sulfide. In most wastewater, these are less common than the Sulfate Reducing Bacteria that use sulfur as an alternative electron acceptor. You would find these organisms in mines, subsea volcanic vents, hot springs, and oil formations.
  • Sulfur Oxidizing Bacteria - chemotrophic bacteria with the metabolic ability to convert reduced sulfur species into sulfur and sulfate. While some species can use nitrate as the electron acceptor, most sulfur oxidizers require oxyen as the terminal electron acceptor. If taken to conclusion, you produce sulfuric acid (H2SO4). These are the well documented sewer corrosion bacteria that can form if a vapor phase H2S concentration reaches sufficient levels. In wastewater, Sulfur Oxidizing Bacteria (SOB) are vital to removing reduce sulfides. This does require alkalinity to buffer the system from pH drop. Common genera of wastewater SOB include Thiobacillus, Anwoodia, Paracoccus, and Thiosphaera.

Solutions to sulfide generation in collection systems, equalization tanks, and headworks.
  • Sulfides can be kept in water phase by increasing pH, adding ferric or sulfide scavengers to the collection system. This is a quick fix, but does not solve generation of sulfides in anoxic/anaerobic zones.
  • Adding alternative electron acceptors to prevent growth of sulfate reducing bacteria - common additions include nitrate, liquid oxygen, and hydrogen peroxide. All work by giving a higher energy electron acceptor than sulfate/sulfide for bacteria in the system.
  • Using a comprehensive control program to prevent sulfide formation. This uses monitoring/testing to find zones where redox potential favors the growth of SRB. To combat the SRB, you add the best alternative electron acceptor based on the location and environmental conditions. We have also found it beneficial to add microbes capable of both using the alternative electron acceptor and oxidizing reduced sulfides. In Aster Bio's products we favor Paracoccus and Thiosphaera as they grow well from 5.5 - 8.5 pH - unlike most Thiobacillus that thrive at pH <5.0 where you get significant H2S formation.
Sulfides are a problem in wastewater. Unless you have an influent source of reduced sulfides, most sulfide is formed in water under anoxic/anaerobic conditions that favor SRB growth. The best solution for sulfides forming in the system is to disfavor the growth of SRB. How to accomplish this requires a system survey and determination of which solution best fits your situation. But before selecting a solution or choosing a single solution for a complex system, do a full survey of Redox (ORP), pH, Total Reduced Sulfides, and H2S.


Why fixed film or MBBR systems do not have F/M ratios

10/3/2018

 
Picture
MBBR media with biofilm. Photo from AAEES.ORG
Activated sludge systems operate by moving a suspended biomass (MLSS) through an aerated basin and then separating solids for recycle back to the aeration basin.  This process was invented in the early 20th century for treating wastewater and many variations on the process exist including contact stabilization, extended aeration, batch reactors, oxidation ditches, and pure oxygen systems.   A key operating parameter has been the Food to Microorganisms (F/M) ratio.   F/M is traditionally calculated using MLSS or MLVSS as the M and BOD5 as the F.   Key is to be consistent and always know what you are using to calculate F/M and identify the best F/M ratio for operations. 

Now we move to biofilm type systems versus suspended growth.   Here we have tricking filters (old but still good), MBBR, and fixed film media.  All relay on a biofilm which is actually just floc grown in attached form.  Calculated F/M in this system is difficult since the biomass is attached to media.  So we operate any biofilm based system on loading per unit of surface area - this can be BOD5/square meter or Ammonia/square meter.   Again just be consistent in calculating.

The key benefit of a biofilm vs suspended growth system is the ability to hold more biomass than comparable activated sludge units which rely totally on solids separation to keep biomass in the aeration tank.  Of course this advantage is not present for all influents.  For example, systems with significant influent oil & grease can foul (coat) the media which can be a big problem.   

    Author

    Erik Rumbaugh has been involved in biological waste treatment for over 20 years. He has worked with industrial and municipal wastewater  facilities to ensure optimal performance of their treatment systems. He is a founder of Aster Bio (www.asterbio.com) specializing in biological waste treatment.

    View my profile on LinkedIn

    RSS Feed

    Click to set custom HTML

    Archives

    December 2022
    November 2022
    October 2022
    September 2022
    August 2022
    June 2022
    May 2022
    March 2022
    February 2022
    January 2022
    November 2021
    October 2021
    September 2021
    August 2021
    June 2021
    April 2021
    March 2021
    February 2021
    December 2020
    November 2020
    October 2020
    September 2020
    August 2020
    July 2020
    June 2020
    May 2020
    April 2020
    March 2020
    February 2020
    January 2020
    December 2019
    November 2019
    October 2019
    September 2019
    August 2019
    July 2019
    June 2019
    May 2019
    April 2019
    March 2019
    February 2019
    January 2019
    December 2018
    November 2018
    October 2018
    September 2018
    August 2018
    July 2018
    June 2018
    May 2018
    April 2018
    March 2018
    February 2018
    January 2018
    December 2017
    November 2017
    October 2017
    September 2017
    August 2017
    July 2017
    June 2017
    May 2017
    April 2017
    March 2017
    February 2017
    January 2017
    December 2016
    November 2016
    October 2016
    September 2016
    August 2016
    July 2016
    June 2016
    May 2016
    April 2016
    March 2016
    February 2016
    January 2016
    December 2015
    November 2015
    October 2015
    September 2015
    August 2015
    July 2015
    June 2015
    May 2015
    April 2015
    March 2015
    February 2015
    January 2015
    December 2014
    November 2014
    October 2014
    September 2014
    August 2014
    July 2014
    June 2014
    May 2014
    April 2014
    March 2014
    February 2014

Proudly powered by Weebly
Photos used under Creative Commons from Picturepest, marcoverch, perzonseowebbyra, Picturepest, Picturepest, dsearls, dungodung, Massachusetts Office of Travel & Tourism, aqua.mech, vastateparksstaff, hile, Aaron Volkening, amishsteve, Neil DeMaster, mklwong88, KOMUnews, Picturepest, kaibara87