• Blog
  • Lab Testing
  • Bioaugmentation Applications
  • Useful Information
  • About Us
BIOLOGICAL WASTE TREATMENT EXPERT
Contact Us

Bioremediation on working industrial sites using slurry injection 

10/31/2016

 
Picture
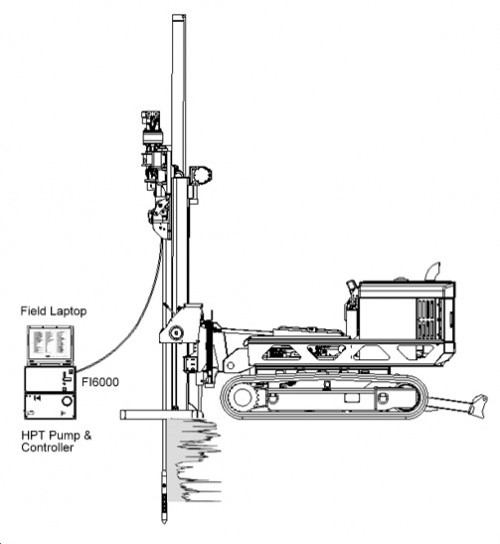
From Geoprobe - www.geoprobe.com
Using bioremediation to detoxify many pollutants has become a common practice. Quick response with a set surface biological treatment has proven very effective in shallow, soil surface spills in tanks farms, rail yards, etc where the contamination is within a few inches of the surface and the contaminant is often crude or fuels such as diesel. In the above case, a quick addition of fertilizer, microbes, and biosurfactant/surfactant blends can reduce TPH to background in anywhere from 21 - 120 days depending upon contamination extent and other environmental variable. Benefits from in-situ treatment include:
  • Avoid risk & costs of transporting contaminated soil off site
  • If on an industrial site, activity can continue without disruption
  • Effective in cleaning soil and not adding waste to RCRA landfills

Last week when presented with a working industrial site having moderate crude oil contamination, I suggested in-situ treatment. The hydrocarbons have accumulated under concrete pads, several feet below the surface (where oxygen is present for aerobic treatment). While evaluating the site, I mentioned slurry injection - a technology developed in the late 1980s for in-situ treatment of soil and groundwater - maybe the best treatment alternative. In short, slurry injection is:
  • High pressure injection into subsurface of a bioremediation "cocktail"
  • Equipment and workers on-site only during injection events (Usually cleaned in 1 - 3 injection events)
  • Works up to 40 feet depth and effective in most soils
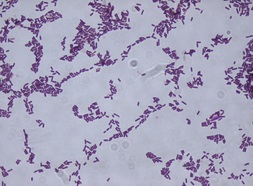
  • Workers inject a blend of oxygen release compounds (ORC), time release nutrients, and a microbial consortia (to rapidly increase the number of aerobic hydrocarbon degrading microbes in the subsurface).
  • Injection points are done on a grid surrounding the contamination to ensure full remediation and build barriers to prevent off-site pollutant migration.
​

Enhanced Biological Phosphate Removal (EBPR) - strategies for favoring growth of PAO (Phosphate Accumulating Organisms) vs GAO (Glycogen Accumulating Organisms)

10/24/2016

 
While looking into research on the problems with GAO in biological phosphate removal systems, I found an interesting thesis by Carlos Manuel LÓPEZ VÁZQUEZ titled "The Competition between Polyphosphate-Accumulating Organisms and Glycogen-Accumulating Organisms: Temperature Effects and Modelling."

In this study, he evaluated the impact of temperature, pH, and Acetate/Priopionate ratios on phosphate accumulation. The main findings were:
  • PAO dominate at temperatures below 20oC with GAO becoming favored above 30oC.
  • Acetate/Propionate ratios between 75:25 - 50:50 favored PAO
  • PAO having a positive correlation with higher pH 
While we are still not completely certain of all the bacteria involved in phosphate accumulation ecological niche, we can use finding from this study to favor their growth. So if you have a problem maintaining a proper ratio of PAO to GAO in the EBPR system, you can try to favor PAO by increasing pH and lowering SRT (PAO have higher growth rates in general).

How fast do bacteria grow in wastewater?

10/18/2016

 
PictureBacillus subtilis
We often hear that bacteria double every 20 minutes. This number is recited in almost all wastewater microbiology classes and technical literature. Is this the right number to use for projecting growth in a wastewater unit during startup or following a loss of activity? 

First, the 20 minute number comes from a typical lab bacteria, E. coli, grown under ideal lab conditions of temperature, pH, sufficient nutrients, and a carbon source (energy) from glucose - which is "bug candy". Unlike my pure lab E. coli  culture, a wastewater unit has many different species of microbes including gram positives, gram negatives, heterotrophic, chemotrophic, obligate aerobic, facultative anaerobic, and even some anaerobic cultures (in some systems). This mix of bacteria forms the MLSS with each organism functioning in various ecological niches as a consortia. We refer to this mix of living bacteria, extracellular materials, and adsorbed particles as MLSS, floc, or biofilm depending upon the system. 

So how fast do these bacteria grow? Well each strain has a different maximum growth rate. Most common heterotrophic (BOD/COD degraders in wastewater) have a doubling time of 30 - 60 minutes. Slower growing organisms appear under adverse conditions (a whole other topic) and are known as r-rate strategists. More delicate cultures such as ammonia oxidizing bacteria have a doubling time measured in hours, which makes them more susceptible to washout and slow to recovery from a toxic shock event.

Also, the numbers above are for growth with ideal medium under lab conditions. In wastewater, we usually operate in much lower F/M conditions which further slows growth. We usually monitor microbial growth/activity using oxygen uptake rates and ATP.  When oxygen uptake rates are high and free ATP is present in the solution, we are experiencing rapid growth. This of course is not ideal for operating a waste treatment plant. As the respiration rates drops and free ATP decreases, we start to see a reduction in cellular growth. Eventually entering the range of ideal F/M conditions where effluent quality is optimal.

So while bacteria can grow very fast under lab conditions, they rarely achieve 20 minute doubling times in wastewater. In fact, we only see max growth rates during startup or following a shock loading. Even then, it takes longer than 20 minutes for the bacteria to double given the nature of wastewater. 

What can cause failure in effluent toxicity testing (bioassay/biomonitoring)

10/13/2016

 
Picture
After permits were installed for organic oxygen demand, ammonia, and other criteria compounds, the US EPA introduced effluent toxicity tests. The bioassay test involves both acute and chronic toxicity evaluation using a set dilution factor and aquatic organisms representing conditions near the effluent discharge. Often the fish species tested are the fathead minnow (Pimophales promelas) and water flea (Ceriodaphnia dubia) but more delicate species such as rainbow trout (Oncorhynchus mykiss) can be used. If a facility fails a bioassay test, a toxicity evaluation process is entered with the goal being to identify and correct the problem. Sometimes the source of toxicity is easily identified in cases such as ammonia, phenol, surfactants, or other toxic chemicals. However, in many cases the problem is not obvious.

In one of my cases, an industrial water treatment facility had failed its bioassay using rainbow trout, a very delicate species. The effluent had excellent BOD/COD/TOC numbers, ammonia was less than 0.2 mg/L, and no other criteria pollutants could be found. The biological treatment unit had excellent biomass, high dissolved oxygen (DO) and every other operational parameter in range. After evaluating all data, the only thing that stood out was the bioassay test was conducted in pure fresh water with low chlorides and near neutral pH. 

The only thing that stood out was an unexpected nitrite residual. Apparently, something in the ammonia oxidation process was creating conditions where nitrite was present in the effluent. Taking a cue from aquaculture work, nitrite increases in toxicity when pH decreases and chlorides are not present in sufficient quantity to prevent nitrite from crossing the gills and binding with hemoglobin (causing brown blood disease). In this case some change in influent makeup and environmental conditions created a biomass with deficient numbers of nitrite oxidizing bacteria (NOB - often called Nitrobacter). The response was:
  1. First screen influent and mixed liquor for inhibition of NOB organisms using a Tox-N test - concentrated paste of both nitrosomonas & nitrobacter for acute toxicity testing.
  2. After finding relatively low toxicity, adding concentrated NOB cultures to the system
  3. Ongoing - careful monitoring of basin nitrite and ammonia. With a rapid response screening and evaluation protocol if nitrite or ammonia increases out of the preset control range.


Aerobic Digester - Degradation of "Unbiodegradable" Organic Solids

10/10/2016

 
Picture
It is interesting when academic research confirms something that you have observed in the field for many years. In this case, aerobic digesters stabilizing MLSS from municipal and industrial systems are modeled on the removal of VSS which contains adsorbed organics, cellular byproducts, and cells. The models maintain that the digester will remove the degradable portion of the VSS leaving an non-degradable VSS residual. The residual was based on looking at COD vs BOD20 which is also called ultimate BOD.

However, certain components of the VSS are more recalcitrant to biodegradation than others. Some parts of the VSS, or any water sample, may take longer than 20 days to be metabolized by microbes. We also see this when simple soluble organics such as sugars inhibit the degradation of fatty acids or grease. Like kids at Halloween, the bacteria go after higher energy yielding "candy" before using complex, lower energy yield compounds.

So when under starvation or very low F/M conditions, the degradation of "resistant" organics begins. This is not well modeled in conventional activated sludge equations. The paper below gives estimates that the degradation rates of “unbiodegradable” VSS between 0.006 to 0.029 d−1.

Friedrich, M. et al. "Experimental Assessmentof the Degradation of "Unbiodegradable" Organic Solids in Activated Sludge" Water Environmental Research Vol. 88, Number 3, 1 March 2016. Abstract


Amoeba in wastewater - good video from a sample today

10/6/2016

 
During startup or after a shock loading, high F/M creates conditions favoring amoeba and flagellate protozoa. Amoeba can have great size variation but are easily distinguished by their unique - amoeboid - movement where pseudopodia stream out and engulf food. In this case, the amoeba is consuming free bacteria and small organic particles in the water. You can see the large number of vacuoles inside the amoeba containing digesting particles.

    Author

    Erik Rumbaugh has been involved in biological waste treatment for over 20 years. He has worked with industrial and municipal wastewater  facilities to ensure optimal performance of their treatment systems. He is a founder of Aster Bio (www.asterbio.com) specializing in biological waste treatment.

    View my profile on LinkedIn

    RSS Feed

    Click to set custom HTML

    Archives

    May 2025
    April 2025
    March 2025
    February 2025
    January 2025
    December 2024
    November 2024
    October 2024
    April 2024
    March 2024
    February 2024
    December 2023
    September 2023
    August 2023
    July 2023
    June 2023
    May 2023
    April 2023
    February 2023
    January 2023
    December 2022
    November 2022
    October 2022
    September 2022
    August 2022
    June 2022
    May 2022
    March 2022
    February 2022
    January 2022
    November 2021
    October 2021
    September 2021
    August 2021
    June 2021
    April 2021
    March 2021
    February 2021
    December 2020
    November 2020
    October 2020
    September 2020
    August 2020
    July 2020
    June 2020
    May 2020
    April 2020
    March 2020
    February 2020
    January 2020
    December 2019
    November 2019
    October 2019
    September 2019
    August 2019
    July 2019
    June 2019
    May 2019
    April 2019
    March 2019
    February 2019
    January 2019
    December 2018
    November 2018
    October 2018
    September 2018
    August 2018
    July 2018
    June 2018
    May 2018
    April 2018
    March 2018
    February 2018
    January 2018
    December 2017
    November 2017
    October 2017
    September 2017
    August 2017
    July 2017
    June 2017
    May 2017
    April 2017
    March 2017
    February 2017
    January 2017
    December 2016
    November 2016
    October 2016
    September 2016
    August 2016
    July 2016
    June 2016
    May 2016
    April 2016
    March 2016
    February 2016
    January 2016
    December 2015
    November 2015
    October 2015
    September 2015
    August 2015
    July 2015
    June 2015
    May 2015
    April 2015
    March 2015
    February 2015
    January 2015
    December 2014
    November 2014
    October 2014
    September 2014
    August 2014
    July 2014
    June 2014
    May 2014
    April 2014
    March 2014
    February 2014

Proudly powered by Weebly
Photos from Picturepest, marcoverch, perzonseowebbyra, Picturepest, Picturepest, dsearls, dungodung, Massachusetts Office of Travel & Tourism, aqua.mech, vastateparksstaff, hile, Aaron Volkening, amishsteve, Neil DeMaster, mklwong88, KOMUnews, Picturepest, kaibara87, Bernd Thaller