• Blog
  • Wastewater Testing
  • Bioaugmentation Applications
  • Useful Information
  • About Us
BIOLOGICAL WASTE TREATMENT EXPERT
Contact Us

Impact of Grease (Lipid) Loadings on Anaerobic Digsters

7/31/2014

 
Picture
I recently read a great article by Dr. D.G. Cirne et al, titled "Anaerobic Digestion of Lipid-Rich Wastes - Effects of Lipid Concentration." This article answers questions on the impact of increased fat, oil & grease concentrations have on anaerobic digester performance with the goal being methane generation.

I was curious about this article since many digesters receiving high FOG loadings experience problems with fatty acid buildup and lower than expected methane production.

Picture
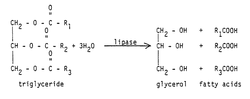
In the past we have tried to remedy this problem by adding enzymes (lipase), micronutrients, and acid forming bacteria in an effort to break down fatty acids into short-chain forms readily used by methanogens.

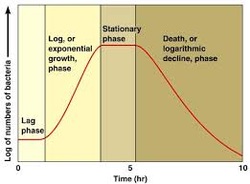
In this study, Cirne evalued the impact of various lipid loadings (5 - 47% of total COD). Also evaluated was the impact of adding free lipase the digester. The authors found that lipid loadings from 5 - 18% had no impact on methane production. However higher grease loadings from 31- 47% exhibited inhibition that increased with higher lipid loadings. In all cases, the microbes eventually converted all the fatty acids to methane, but the lag associated with the process is what causes problems with digesters run in continuous flow operation.

Adding free lipase to the digester increased the amount of inhibition. This counter-intuitive finding reveals that the methanogen inhibition is caused by a long chain fatty acid buildup from the initial grease splitting. The addition of lipase immediately splits the fats into glycerol and 3 long chain fatty acids which exacerbates the already increased VFA production from the indigenous break down of grease.

For operations, the study shows that a digester can handle high grease loadings if the residence time is long enough. In practice, most digesters do not have this level of retention time so grease loadings should be limited to below 18%.

 Non-Filamentous (Viscous) Bulking

7/28/2014

 
PictureIndia Ink Showing Excessive EPS in Floc
Non-filamentous bulking is often overlooked as a wastewater treatment problem. Operators facing viscous bulking often complain of "gelatinous" floc, that billows over the clarifier weir and is difficult to dewater on the secondary press.

We see viscous bulking when the bacteria begin to produce excessive quantities of extracelluar polysaccharides (EPS). In normal good floc, it is the EPS that acts as the glue to hold bacteria cells and adsorbed (outside cell wall) particles. When cells begin to overproduce the EPS, the previous glue begins to hold excessive amounts of water and is very vulnerable to sheer. The resulting sludge does not compact well and can easily be carried over secondary weirs. The return sludge (RAS) concentration is lower as we are returning more water relative to biological solids which further compounds the problem.

You can see viscous bulking under normal light microscopy as "fingers" and gelatinous appearance. The appearance can be enhanced for better observation by adding India Ink to the slide. The India Ink will not penetrate the EPS and will appear as clear zones around the floc.


Causes of Viscous Bulking


  • Lack of a vital macronutrient (Nitrogen or Phosphorus)
  • Micronutrients (Fe, Mg, etc) being deficient
  • Excess influent organic acids usually from anaerobic activity
  • High fat, oil & grease loadings
  • Temperature stress

Control Options
  • Check nutrients and add as necessary
  • Increase wasting to rid system of existing viscous floc
  • In severe cases, we often couple wasting with seeing cultures (bioaugmentation). In this case we use cultures with excellent floc forming characteristics and often seed with strains capable of producing cationic EPS versus the more common anionic EPS.

Rotifers - a good indicator organism?

7/25/2014

 
Picturehttp://www.ucmp.berkeley.edu
Rotifers are among the largest indicator organisms commonly found in wastewater treatment plants. I realized the other day after looking at storm water pond samples that I had never talked about rotifers on this blog.

In wastewater treatment, rotifers are associated with "good" treatment where all major treatment parameters have been met. As a large - 0.5 - 2mm organism, the rotifer is interesting in that it is a multicellular creature with visible mouth, digestive system, and discrete organs. They can be attached to floc where they feed on  bacteria and other organic particles.

In wastewater, we see rotifers appear under low F/M (Food/Microorganism Mass) or "older" sludge ages. There also has to be sufficient dissolved oxygen and bacteria floc. So, we have an indicator organisms found in "good" system health that is easily observed - what makes them a "less than ideal indicator organism?" I'll list the pros and cons below:

            Pros                                                                    Cons
   
Easily observed                                            Somewhat resistant initial spills
    Seen with low F/M                                        Usually indicate an older sludge than optimal


Surface Films and Odors in Ponds/Lagoons

7/21/2014

 
PictureCyanobacteria Bloom
Ponds often develop surface films often develop in warmer months. Environmental conditions promoting film formation include warm weather, low flows, and sunlight promoting algae blooms. While a slight film may cause no problems it can promote conditions for odor complaints (H2S & volatile organic acids) and be a precursor to an algae bloom. In this post I will cover what compromises the film and how it arises in the pond.

While algae is important for normal pond activity. Excessive nutrients and summer temperatures can lead to a cyanobacteria bloom. These "algae" are actually a photosynthetic bacteria. They tend to form a bright green, blue-green surface scum and increase suspended solids in the pond. Besides causing problems with effluent TSS, cyanobacteria produce chemicals that contribute to odors and off-flavors in ponds. If the bloom is substantial, cyanobacteria can also prove deadly to wildlife. In 2013, an elk herd in New Mexico drank from a pond with a cyanobacteria bloom and was found dead in the immediate vicinity.


PictureNote foam & slight film on surface
The second source of film is less obvious from cursory visual clues. In a quiescent lagoon with anaerobic activity often forms a film containing fatty acids. Since the fatty acids are naturally hydrophobic, we get in effect a "soap scum" on the surface. This film layer prevents normal oxygen transfer which further increases the size of the anaerobic zone. As a result, the pond often produces H2S and other malodorous compounds.


Dissolved Oxygen Uptake Rates - Why is this test important?

7/17/2014

 
PictureSource: igem.org
Dissolved Oxygen Uptake Rate (DOUR) and Specific Oxygen Uptake Rate (SOUR) are often used to monitor  biological system health on a daily basis. When used frequently, oxygen uptake rates show changes in bacteria growth/respiration rates. I have included the protocol in the at the end of this post, but I wanted to discuss what OUR monitors and what various changes mean to daily operations.

What Oxygen Uptake Rate tests monitor
The DO meter reads oxygen changes in a saturated sample over a set period of time. The changes in dissolved oxygen are primarily due to the use of oxygen by microbes in the sample. (Chemicals can exert some demand, but in most biological units the change is due to microbes.)

If the microbes are dividing and growing rapidly (log phase growth), the DOUR will be high.  A system with a sudden increase in OUR indicates more soluble organics (BOD) which can impact effluent BOD, nitrification, and TSS.

Following a spill with more toxic influents, the OUR can suddenly drop which indicates the biomass is actually not reproducing and/or in the lag phase where growth is low or stopped. We also see low OUR when the influent loadings are reduced (low influent BOD) - as seen during process unit shutdown.

By doing OUR tests on a daily basis, we are collecting baseline data  that ties oxygen uptake to other parameters including effluent BOD/COD, nutrient removal, TSS removal, and effluent toxicity. When operators see OUR numbers outside normal ranges, they can immediately begin to search for  causes and begin protocols to protect effluent quality.


Retention Pond & Polishing Pond Algae Control

7/15/2014

 
Picture
Retention ponds are used in a number of situations to remove pollutants prior to discharge into receiving streams. Small ponds are often seen near parking lots, gas stations, or neighborhoods where the ponds are used to treat for oil sheen, fertilizer run-off, and other pollutants. Larger ponds are often found at the end of wastewater treatment systems and are vital for "polishing" the effluent by removing residual TSS while removing small quantities of BOD, ammonia, phosphate, or other criteria pollutants.


Read More
<<Previous

    Author

    Erik Rumbaugh has been involved in biological waste treatment for over 20 years. He has worked with industrial and municipal wastewater  facilities to ensure optimal performance of their treatment systems. He is a founder of Aster Bio (www.asterbio.com) specializing in biological waste treatment.

    View my profile on LinkedIn

    RSS Feed

    Click to set custom HTML

    Archives

    December 2022
    November 2022
    October 2022
    September 2022
    August 2022
    June 2022
    May 2022
    March 2022
    February 2022
    January 2022
    November 2021
    October 2021
    September 2021
    August 2021
    June 2021
    April 2021
    March 2021
    February 2021
    December 2020
    November 2020
    October 2020
    September 2020
    August 2020
    July 2020
    June 2020
    May 2020
    April 2020
    March 2020
    February 2020
    January 2020
    December 2019
    November 2019
    October 2019
    September 2019
    August 2019
    July 2019
    June 2019
    May 2019
    April 2019
    March 2019
    February 2019
    January 2019
    December 2018
    November 2018
    October 2018
    September 2018
    August 2018
    July 2018
    June 2018
    May 2018
    April 2018
    March 2018
    February 2018
    January 2018
    December 2017
    November 2017
    October 2017
    September 2017
    August 2017
    July 2017
    June 2017
    May 2017
    April 2017
    March 2017
    February 2017
    January 2017
    December 2016
    November 2016
    October 2016
    September 2016
    August 2016
    July 2016
    June 2016
    May 2016
    April 2016
    March 2016
    February 2016
    January 2016
    December 2015
    November 2015
    October 2015
    September 2015
    August 2015
    July 2015
    June 2015
    May 2015
    April 2015
    March 2015
    February 2015
    January 2015
    December 2014
    November 2014
    October 2014
    September 2014
    August 2014
    July 2014
    June 2014
    May 2014
    April 2014
    March 2014
    February 2014

Proudly powered by Weebly
Photos used under Creative Commons from Picturepest, marcoverch, perzonseowebbyra, Picturepest, Picturepest, dsearls, dungodung, Massachusetts Office of Travel & Tourism, aqua.mech, vastateparksstaff, hile, Aaron Volkening, amishsteve, Neil DeMaster, mklwong88, KOMUnews, Picturepest, kaibara87