• Blog
  • Wastewater Testing
  • Bioaugmentation Applications
  • Useful Information
  • About Us
BIOLOGICAL WASTE TREATMENT EXPERT
Contact Us

Microbial Community Analysis - Interpreting the Taxonomy Chart

9/28/2021

 
Microbial Community Analysis (MCA) relies on uses 16s rDNA to provide a microbial census of all organisms in the MLSS. The resulting data includes over 100 GB of individual sequences that are then run through databases to give us the ID and relative frequency of what is present. The challenge has been in interpreting this complex data. To help with interpretation, we include in our reports a "Taxonomy Chart", which we find a useful. In fact, it's usually the first place that we look when reviewing data. However, the chart layout does require some explanation. 

Bacteria are classified in a hierarchical taxonomy, from the broadest categories to the most specific: kingdom, phylum, class, order, family, genus, species, and in many cases, subspecies or strains. Some times, an MCA is unable to identify a population to the genus level, but the higher (more general) taxonomic levels can still provide some information: for example, the Firmicutes, which contain Bacillus and Clostridium, generally contain either facultative or obligate anaerobes. High levels of Firmicutes may suggest low dissolved oxygen in a system.

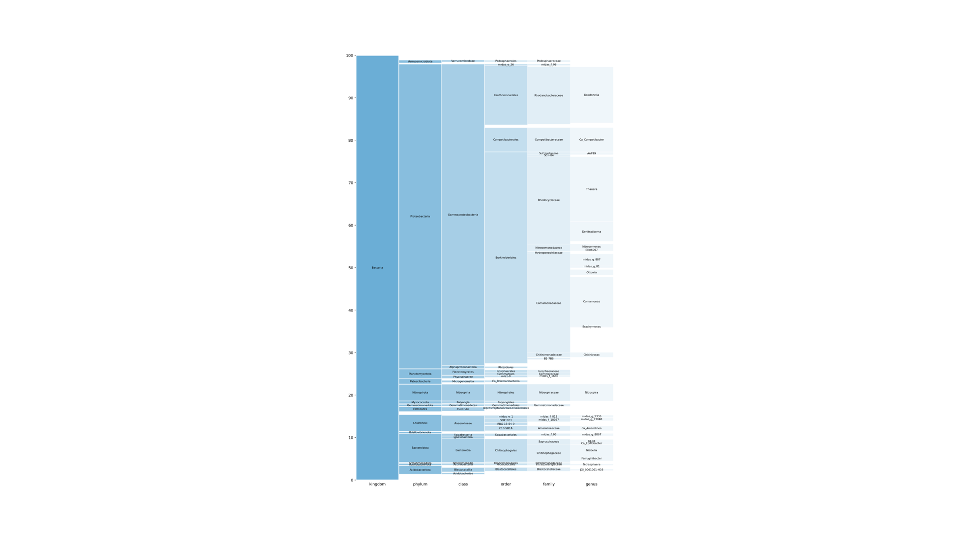
Our taxonomy chart is similar to stacking a bunch of bar charts side by side, showing the relative amounts of each taxon present at a taxonomic level, but with a twist. The first column covers the kingdom. In the example below, this kingdom is Bacteria, and it represents over 99% of the sequences. The next level shows the different phyla present in the sample, with Proteobacterium being the most-represented phylum. The chart repeats this all the way down to the genus level.
Picture

How changes in F/M impact microbial populations

9/14/2021

 
Picture

Did you know that microbial populations in wastewater are constantly changing? F/M or influent organic makeup and concentrations are a major influence as to what microbes are present. Other factors influencing microbial populations include temperature, pH, D.O., inhibitory compounds, and macronutrients.

An underused tool in wastewater treatment is to check your system against the growth curve. A perfect way to watch the growth curve is in an aerated lagoon system since you move from lag or log phase growth all the way to endogenous respiration. 

Typical Aerated Lagoon Microbial Populations
Near the influent, you have high concentrations of organics with low microbial populations. This favors r-strategists - microbes with high growth rates. Other growth pressures include the presence of inhibitory compounds or tough environmental conditions. Using Microbial Community Analysis testing, we have found that many of these organisms are the most evaluated genera used in laboratory experiments.

By the mid-point of the example lagoon, soluble BOD5 is 80% removed and organisms that have new growth strategies become the dominant organisms. You notice an increase in EPS and cells forming floc. Indicator protozoa begin to favor ciliates and other more advanced forms. This is also where you have AOB & NOB populations becoming more active.

Moving through the system to the polishing pond, almost all soluble BOD5 is removed and floc is settling into a sludge layer where endogenous respiration occurs. 

Comparing a Lagoon to Activated Sludge
While you can move along the growth curve as water moves through a lagoon system, Activated Sludge with recycle MLSS tend to operate in a section of the growth curve. In conventional ASU systems, you target Decline Phase growth for maximum floc formation, BOD5 removal, and nutrient removal. Extended aeration systems and modern high MLSS (low F/M) systems also have endogenous respiration where cells lyse and solids yield decreases.

Using the MCA testing on ASU systems, we can identify the ideal mix of microbes for a given system. The organisms mix changes with influent and operational changes, but knowing the microbial mix allows for you to better identify your location on the growth curve and can help improve operational decisions.

My next blog posts will be from example MCA testing and show how microbial populations are impacted by system type and operations.

    Author

    Erik Rumbaugh has been involved in biological waste treatment for over 20 years. He has worked with industrial and municipal wastewater  facilities to ensure optimal performance of their treatment systems. He is a founder of Aster Bio (www.asterbio.com) specializing in biological waste treatment.

    View my profile on LinkedIn

    RSS Feed

    Click to set custom HTML

    Archives

    December 2022
    November 2022
    October 2022
    September 2022
    August 2022
    June 2022
    May 2022
    March 2022
    February 2022
    January 2022
    November 2021
    October 2021
    September 2021
    August 2021
    June 2021
    April 2021
    March 2021
    February 2021
    December 2020
    November 2020
    October 2020
    September 2020
    August 2020
    July 2020
    June 2020
    May 2020
    April 2020
    March 2020
    February 2020
    January 2020
    December 2019
    November 2019
    October 2019
    September 2019
    August 2019
    July 2019
    June 2019
    May 2019
    April 2019
    March 2019
    February 2019
    January 2019
    December 2018
    November 2018
    October 2018
    September 2018
    August 2018
    July 2018
    June 2018
    May 2018
    April 2018
    March 2018
    February 2018
    January 2018
    December 2017
    November 2017
    October 2017
    September 2017
    August 2017
    July 2017
    June 2017
    May 2017
    April 2017
    March 2017
    February 2017
    January 2017
    December 2016
    November 2016
    October 2016
    September 2016
    August 2016
    July 2016
    June 2016
    May 2016
    April 2016
    March 2016
    February 2016
    January 2016
    December 2015
    November 2015
    October 2015
    September 2015
    August 2015
    July 2015
    June 2015
    May 2015
    April 2015
    March 2015
    February 2015
    January 2015
    December 2014
    November 2014
    October 2014
    September 2014
    August 2014
    July 2014
    June 2014
    May 2014
    April 2014
    March 2014
    February 2014

Proudly powered by Weebly
Photos used under Creative Commons from Picturepest, marcoverch, perzonseowebbyra, Picturepest, Picturepest, dsearls, dungodung, Massachusetts Office of Travel & Tourism, aqua.mech, vastateparksstaff, hile, Aaron Volkening, amishsteve, Neil DeMaster, mklwong88, KOMUnews, Picturepest, kaibara87