• Blog
  • Wastewater Testing
  • Bioaugmentation Applications
  • Useful Information
  • About Us
BIOLOGICAL WASTE TREATMENT EXPERT
Contact Us

Ananerobic Digester StartupĀ 

10/30/2014

0 Comments

 
Picture
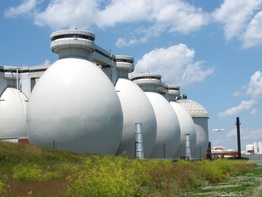
Municipal Anaerobic Digesters
I follow several online discussion groups that discuss wastewater treatment. Recently, a member asked questions on how to speed up the commissioning of an anaerobic digester. Looking through the responses, there are many good suggestions and quite a few offering a product with little technical backup. As I work with manufacturing of waste degrading cultures, I wanted to clarify their potential to help improve anaerobic digester performance and speed up startup of new digesters.

First, commercially available microbial cultures are composed of mostly aerobic and facultative anaerobic microbes. In the anaerobic digester, these microbes can initiate decomposition via hydrolysis of organics. Often these cultures can also increase production of volatile acids. This is where commercially produced cultures stop being useful in anaerobic digesters! Often this is not the problem with anaerobic digester startup or during normal operation.

The rate limiting step in digesters is usually to conversion of hydrogen and volatile organic acids into methane. This is the mechanisms by which COD is removed from the unit. Unlike the commercial cultures, the methane is produced by cultures called methanogens. These archea microbes are obligate anaerobes that only grow in a highly reduced (low ORP) environment. The presence of oxygen is toxic to methanogens. This problem with oxygen toxicity makes a preserved methanogen product unlikely to be offered on the market.

Here is how I would suggest the engineer startup a digester:
  • Enure all equipment is in working order and fill with influent to displace all oxygen in the unit and prevent external oxygen from entering
  • Maintain temperature at at least 30oC to improve methanogen growth
  • Add sludge from a properly operating anaerobic digester with good methane production
  • The sludge should be trucked in and carefully added to prevent excess exposure to oxygen
  • As methanogens require micronutrients that are often limiting in many waste streams, it is usually useful to add an anaerobic micronutrient package that includes Fe, Mg, Mn, Ni, Co, Cu, and Zn.
  • If VFA production is not sufficient or a boost in hydrolysis is needed, the adding of commercial cultures such as Bacillus, Clostridium, and other acid forming microbes can be useful.

0 Comments

Dissolved Oxygen Optimization & Reducing Utility Costs

10/23/2014

1 Comment

 
Supplying dissolved oxygen typically uses between 40 - 60% of the electricity used in waste water treatment. Many facilities have enough aeration capacity for maximum loading design which well above average daily loadings. In the short run managing aeration by optimizing blower or surface aeration operation can cut electricity use. However, in many cases we rely on the diffusers & mechanical aerators for mixing as well as dissolved oxygen. So while we may have enough dissolved oxygen but not have enough mixing to keep biological solids suspended. Optimizing both aeration and mixing can help reduce utility costs. Here is how to optimize aeration:

  • Take D.O. readings in the basin at various locations & depths on several days to get a DO profile
  • By taking multiple readings in the basin, you can confirm or question the readings on the typical basin side DO meter
  • Adjust blowers and aerators to maintain DO of 2.0 at the sampling points in the system. At a DO of 2.0, there is enough oxygen for ammonia removal and the aerobic carbonaceous bacteria (normal COD/BOD removing microbes) are at 90% efficiency. Compare this to a DO of 3.5 which increases utility costs substantially yet only gives a few more % increase in microbial efficiency
1 Comment

What's eating my biomass? - Red Worms, Blood Worms & Midge Fly Larvae

10/13/2014

9 Comments

 
PicturePicture - TPO Magazine
Call them red worms, blood worms, or midge fly larvae, all are names for chiromid larvae are not welcome in your wastewater treatment plant. These larvae can thrive in a lightly loaded pond or wastewater treatment unit with oxygen levels above 2.0 mg/L. The adult midge lay eggs which then hatch producing larvae that consume bacterial floc as they grow. After several days, the larvae undergo metamorphosis resulting in adult midge flies that start the cycle all over again. In addition to "eating" the active biomass, the larvae can cause effluent TSS problems and loss of ammonia removal efficiency (nitrifiers grow more slowly than other bacteria and "wash out"). While the adult flies do not bite, they are annoying as they swarm in areas near the wastewater plant.

Control Options
I have seen numerous ways people have tried to control midge flies from using pesticides to dosing hypochlorite to the system. The above control attempts can actually cause more problems! Research has found two methods for excellent control of a midge larvae infestation - they are also US EPA approved for control of midge in wastewater.

Option 1 - Use Bacillus thruringensis (AquabacXT) - Becker Microbial Products
Bt slurry produced from the spores of a common bacteria works effectively to kill larvae. Dosed at 10-50 ppm over a few day period, the Bt slurry will be consumed by the larvae which damages their gut .... thereby killing the larvae.

Option 2 - Use Strike an insect growth regulator - Adapco
While not as "natural" as the Bt, strike only impacts the growth/reproductive cycle of the midge larvae. Strike is added near the influent at a rate of 5 ounces per million gallons flow. By adding this dose for 10 - 14 days the midge larvae will be brought under control.

What if I have lost substantial amounts of my biomass and see increased effluent ammonia?
The first step in stopping biomass loss from midge larvae is to use one of the control options to eliminate the infestation. After commencing the control option, I would wait 24 hours. You can wait for biomass to naturally regrow, or to speed up the process seed the system commercial bacterial bioaugmentation product. We have been able to restore normal biological activity and increase MLSS to needed levels within 3 - 4 days.

9 Comments

Viscous or non-filamentous bulking

10/9/2014

0 Comments

 
PictureIndia Ink Slide with excessive EPS
I have recently had more people asking about viscous or non-filamentous bulking. I will quickly go over what viscous bulking looks like and associated symptoms. Then we can cover the most common causes and solutions available to operators.

First, viscous bulking is caused when bacteria begin to produce excessive amounts of extracellular polysaccharides (EPS). When in normal concentrations EPS acts like a glue to increase floc size and density, excess EPS can entrap water and form a "gel" like floc that is easily suspended by water currents. (The floc bulk density is nearing that of water). At this point the suspended floc goes over the clarifier weir, can cause problems with polymer demand, increase water in wasted sludge, and cause problems maintaining permit. In addition to holding additional water in the floc, the EPS can also have an abnormal charge density that changes polymer demand.

How to test for viscous bulking:

  • Visual - notice billowing floc in clarifier
  • Microscopic exam - operators notice rounded floc with sections appearing "gel" like
  • Use India Ink - a drop of India Ink on the microscopic exam slide will give a good estimate of bulking. The India Ink will penetrate normal floc turning it dark. Excessive EPS remains clear or light gray as the ink does not penetrate the EPS gel.
  • SV30 - often viscous bulking appears as a "greasy" or slimey floc.
Causes of viscous bulking:
  • Usually caused by a nutrient deficiency - either nitrogen or phosphorus check residuals at effluent
  • Can also be caused by certain influents such as high FOG, toxic compounds, or high levels of easily soluble organics such as alcohols or sugars.

Solutions:
  • Wasting - once floc exhibits viscous bulking it does not go back to normal under wastewater system conditions. It is necessary to waste most of excessive EPS floc form the system.
  • Add nutrients - it is critical to increase nutrients to an ideal range. Often in industrial wastewater it is critical to add  additional phosphate.
  • While wasting and increasing nutrient feed, we often find it highly beneficial to add microbes (bioaugmentation) cultures. This has the advantage over trucking in sludge as it contains only active microbes which work within existing biomass to control the excessive EPS production and restore the system to normal efficiency.
0 Comments

Plug Flow, Complete Mix Which Is Better?

10/6/2014

7 Comments

 
Picture
Wastewater treatments systems are usually thought of as a plug flow, complete mix, or some hybrid type reactor. While most people know the definition of the reactors, they do not know when one is preferred over another.

Plug Flow
Best pictured as a pipe where flow moves in one direction, a tracer entering a plug flow system exits completely at Volume/Flow. There is no dispersion or back-mixing to “equalize” or mix flows from multiple time periods. We often see plug flow reactor systems where influent has little variation and no toxicity/inhibition to the biomass. In practice we rarely see a true plug flow reactor as aeration systems create some degree of mixing/dispersion.

Complete Mix
A complete mix reactor (or CSTR) is often modeled by a beaker wither a single large impeller. In this ideal example, a tracer added to the inlet is immediately dispersed evenly throughout the reactor. The tracer will appear in the effluent as the tracer/volume concentrations.  A CSTR is often used in systems with influent variation and toxicity/inhibition issues caused by high concentrations of the inhibitory compounds. The immediate dispersal/dilution allows for microbial activity to commence as the inhibitory concentration levels are avoided.

Hybrid Flows
In practice we rarely see a true plug flow or complete mix reactor. We often have hydraulic patterns that are somewhere in between the two ideal regimes. For example a long rectangular basin with aeration (either surface of diffusers) often has significant dispersion and back mixing so we have a lag before tracer appears at the effluent, but it appears well before time = volume/flow.

What makes hybid systems interesting is as you increase the number of cells or individual areas modeled by CSTR flows (occurs near a surface aerator), the overall tracer response appears closer to the plug flow ideal where tracer reaches the effluent near the design residence time.

The hybrid flow is used often because it is a more “natural” flow pattern and provides benefits of both ideal flow systems. To determine a working systems’ flow pattern, you can look at spill response data or run a Tracer Study where a conservative tracer is added and monitored at the effluent.


7 Comments

    Author

    Erik Rumbaugh has been involved in biological waste treatment for over 20 years. He has worked with industrial and municipal wastewater  facilities to ensure optimal performance of their treatment systems. He is a founder of Aster Bio (www.asterbio.com) specializing in biological waste treatment.

    View my profile on LinkedIn

    RSS Feed

    Click to set custom HTML

    Archives

    December 2022
    November 2022
    October 2022
    September 2022
    August 2022
    June 2022
    May 2022
    March 2022
    February 2022
    January 2022
    November 2021
    October 2021
    September 2021
    August 2021
    June 2021
    April 2021
    March 2021
    February 2021
    December 2020
    November 2020
    October 2020
    September 2020
    August 2020
    July 2020
    June 2020
    May 2020
    April 2020
    March 2020
    February 2020
    January 2020
    December 2019
    November 2019
    October 2019
    September 2019
    August 2019
    July 2019
    June 2019
    May 2019
    April 2019
    March 2019
    February 2019
    January 2019
    December 2018
    November 2018
    October 2018
    September 2018
    August 2018
    July 2018
    June 2018
    May 2018
    April 2018
    March 2018
    February 2018
    January 2018
    December 2017
    November 2017
    October 2017
    September 2017
    August 2017
    July 2017
    June 2017
    May 2017
    April 2017
    March 2017
    February 2017
    January 2017
    December 2016
    November 2016
    October 2016
    September 2016
    August 2016
    July 2016
    June 2016
    May 2016
    April 2016
    March 2016
    February 2016
    January 2016
    December 2015
    November 2015
    October 2015
    September 2015
    August 2015
    July 2015
    June 2015
    May 2015
    April 2015
    March 2015
    February 2015
    January 2015
    December 2014
    November 2014
    October 2014
    September 2014
    August 2014
    July 2014
    June 2014
    May 2014
    April 2014
    March 2014
    February 2014

Proudly powered by Weebly
Photos used under Creative Commons from Picturepest, marcoverch, perzonseowebbyra, Picturepest, Picturepest, dsearls, dungodung, Massachusetts Office of Travel & Tourism, aqua.mech, vastateparksstaff, hile, Aaron Volkening, amishsteve, Neil DeMaster, mklwong88, KOMUnews, Picturepest, kaibara87