• Blog
  • Wastewater Testing
  • Bioaugmentation Applications
  • Useful Information
  • About Us
BIOLOGICAL WASTE TREATMENT EXPERT
Contact Us

High residence time equalization tanks (EQ) and potential for septicity (organic acid production)

12/13/2017

 
Picture
Septicity in wastewater refers to the byproducts of fermentative or anaerobic microbial processes. When redox conditions drop as microbes consume available dissolved oxygen, the organisms use alternative electron acceptors ending with the production of organic acids, hydrogen gas, and methane. In most EQ tanks, we have fermentative respiration occurring. Fermentation produces organic acids - if sulfate was present in the influent it will also result in H2S production. In an EQ tank we don't usually see much growth of methanogens which would convert organic acids into methane. While this microbial process does reduce overall ultimate BOD (BOD20) or COD, the process can create treatment challenges if the biological treatment unit. How can high organic acids upset a biological treatment unit?
  • Short chain organic acids are very readily degradable. Coupled with the low redox potential of the septic water, this creates a very high oxygen demand at the biological system inlet. Low D.O. conditions favor organisms with higher surface areas - which are the low DO filaments.
  • Sulfides with the organic acids can also promote the growth of filaments with sulfur metabolism - this includes Thiothrix sp., Type O21N and Beggiatoa.
  • Odors - short chain volatile fatty acids, mercaptans, and sulfides formed in the EQ tank can "flash off" from the well mixed & aerated biological treatment unit causing odor complaints.
So what can be done about EQ tank septicity?
  • Increase redox potential to prevent fermentative respiration & sulfate respiration
  • To increase redox potentials, you can add aeration/mixing. We are not looking for a DO residual just increase redox potential to a point where fermentation does not occur.
  • If aeration is not possible, you can add nitrate. Add just enough nitrate to prevent strongly negative redox conditions. Other alternative electron acceptors are available, but nitrate is a low cost, stable option.
More on wastewater treatment plant monitoring

12/8/2017

 
Picture
In addition to the last post's "field"tests - remember those tests should be run within 30 minutes of collecting samples if at all possible - there are more daily tests useful for describing biomass health or activity.

MLSS/MLVSS
 - running the solids in the wastewater mixed liquor gives us information needed to calculate F/M and MCRT (solids residence time) in the system. Often I hear people say MLVSS = microbial population. It does NOT directly measure the microbial population. In the days before ATP or molecular testing, the only way to measure microbial populations was by plate count. Not everything grows on plate count media and it takes 24 - 48 hours to get results. So engineers substituted the use of solids testing. MLSS = the solids weight once water is removed. MLVSS = the volatile solids portion of the sludge. My main message is that while F/M and MCRT are normal control tools, they are not hard fast rules for all systems. Much variation is possible and you have to make your system work based on flows and influent makeup. Also use running averages for calculating F/M and MCRT - otherwise you will be adjusting wasting rates too often. And, never increase wasting by more than 10 - 15% in any adjustment.

Macro Nutrients (N & P) - not every system has potential for low macronutrients. However many industrial systems can have low N and/or P. In all cases you want to evaluate ASB for ammonia and ortho-phosphate residuals. As long as ammonia is 1.0 mg/L and phosphate is 0.5 mg/L you have enough residual to prevent nutrient deficiency.

COD/TOC - BOD5 testing takes five days so I like to see COD or TOC data which is usually available within 3 hours of taking samples. This can be used in calculate F/M and monitor influent quality.

Operator tests for managing an activated sludge plant - what are the 'best' tests to run for daily operation - Part 1

12/4/2017

 
Picture
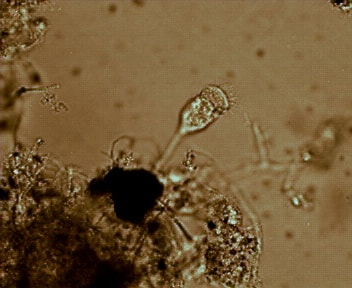
Stalk ciliate 400x - taken with standard light microscope.
Often operators perform tests and enter numbers onto a sheet or computer once a shift. In addition to the number, many of the tests have observational components that may or may not be noted. And, don't discount the power of observation in normal management of an ASU. Unlike calculated data such as F/M or MCRT, test observations and data are real time actionable items that can be used to keep the system in the ideal treatment range. Here are the field tests that I run and like to see in activated sludge systems.

Microscopic Exam - Here you want to note floc size & density, bacteria in free solution, protozoa, metazoa (rotifers), filamentous bacteria, non-filamentous bulking (India Ink test). Changes in floc and protozoa are the first indicators of changes - daily observation helps you know what is normal and spot potential problems early on.

SV30 & SVI - Settling tests give great information on floc quality entering the secondary clarifier. Look beyond just the 30 minute number - note settling rates, supernatant turbidity, let it settle for an additional time to more simulate your clarifier (2 - 4 hours), floating solids after longer settling, and a shaggy appearance caused by filamentous organisms. It is important to use the same vessel for the SV30 test each time - wall effects in cylinders and settleometers can change results.

Oxygen Uptake Rates - aerobic biological waste treatment microbes use oxygen to treat influent pollution. The OUR or DOUR test saturates a sample of MLSS with oxygen and you read oxygen consumption over a short time period. Report results in mg O2/L/hr. If you divide the OUR result by MLSS or MLVSS in grams - you have the standardized oxygen uptake rate - just make sure that you use MLSS or MLVSS as the divisor each time. As with all tests, be consistent.

​

Energy use for drinking & wastewater treatment/distribution

12/1/2017

 
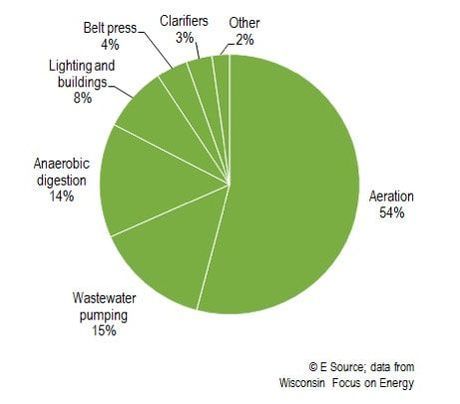
Wastewater and municipal drinking water treatment systems account for about 3 percent of total US energy consumption and approximately 35 percent of the total energy consumed by municipalities.  Small changes to improve energy efficiency can result in big changes in operational costs.
Picture

    Author

    Erik Rumbaugh has been involved in biological waste treatment for over 20 years. He has worked with industrial and municipal wastewater  facilities to ensure optimal performance of their treatment systems. He is a founder of Aster Bio (www.asterbio.com) specializing in biological waste treatment.

    View my profile on LinkedIn

    RSS Feed

    Click to set custom HTML

    Archives

    December 2022
    November 2022
    October 2022
    September 2022
    August 2022
    June 2022
    May 2022
    March 2022
    February 2022
    January 2022
    November 2021
    October 2021
    September 2021
    August 2021
    June 2021
    April 2021
    March 2021
    February 2021
    December 2020
    November 2020
    October 2020
    September 2020
    August 2020
    July 2020
    June 2020
    May 2020
    April 2020
    March 2020
    February 2020
    January 2020
    December 2019
    November 2019
    October 2019
    September 2019
    August 2019
    July 2019
    June 2019
    May 2019
    April 2019
    March 2019
    February 2019
    January 2019
    December 2018
    November 2018
    October 2018
    September 2018
    August 2018
    July 2018
    June 2018
    May 2018
    April 2018
    March 2018
    February 2018
    January 2018
    December 2017
    November 2017
    October 2017
    September 2017
    August 2017
    July 2017
    June 2017
    May 2017
    April 2017
    March 2017
    February 2017
    January 2017
    December 2016
    November 2016
    October 2016
    September 2016
    August 2016
    July 2016
    June 2016
    May 2016
    April 2016
    March 2016
    February 2016
    January 2016
    December 2015
    November 2015
    October 2015
    September 2015
    August 2015
    July 2015
    June 2015
    May 2015
    April 2015
    March 2015
    February 2015
    January 2015
    December 2014
    November 2014
    October 2014
    September 2014
    August 2014
    July 2014
    June 2014
    May 2014
    April 2014
    March 2014
    February 2014

Proudly powered by Weebly
Photos used under Creative Commons from Picturepest, marcoverch, perzonseowebbyra, Picturepest, Picturepest, dsearls, dungodung, Massachusetts Office of Travel & Tourism, aqua.mech, vastateparksstaff, hile, Aaron Volkening, amishsteve, Neil DeMaster, mklwong88, KOMUnews, Picturepest, kaibara87