• Blog
  • Wastewater Testing
  • Bioaugmentation Applications
  • Useful Information
  • About Us
BIOLOGICAL WASTE TREATMENT EXPERT
Contact Us

Membrane Reactors (MBR) and changing the typical water treatment mindset

11/27/2016

 
At this past WEFTEC in September, I noticed more manufacturers promoting the latest in in membrane biological treatment technology. After walking through all the exhibits and working with two recent vintage membrane systems, I noticed that in working with a membrane system a new mindset for the biological side of the equation is required. Let me explain below:

Traditional Suspended Growth Systems
  • Want floc formation for solids removal
  • Filamentous microbes are a problem and must be monitored
  • EPS (Extracellular polymers) are normally good
  • Worry about settling rates (SV30 & SVI)

MBR Systems
  • No need to worry about floc formation - membrane takes care of all solids above the pore size
  • Filaments are finally not an issue - we can finally use their unique metabolic properties!
  • EPS can be bad for blinding the pores in the membrane
  • Viscous bulking can be a very bad problem for solids separation in the membrane
  • Less need to worry about SV30 & SVI
  • Interesting forms such as granular aerobic floc are possible with the long sludge ages
  • No need to worry about solids flux (settling rates)

Bioaugmentation - Truth vs Myth

11/16/2016

 
Since my company, Aster Bio, manufactures biological products including bioaugmentation cultures; I read many claims, studies, and comments on bioaugmentation (adding exogenous microbes to an environment). Often people selling bioaugmentation products give huge claims on product effectiveness (some of which are not possible). To counter this, critics often dismiss any potential application of bioaugmentation technology as "snake oil", "magic dust", or other dismissive name. Which group is correct? - Well as with many technologies, the truth is somewhere between the two extremes.

Below are listed the time-tested applications of bioaugmentation followed by the limits of bioaugmentation (even biological treatment as a whole):

Bioaugmentation - Proven Applications
  • Startup of a wastewater treatment system
  • Recovery following loss of biomass due to toxic event, mechanical failure, or washout
  • Reduce acclimation time to a new waste stream or to combat variation in influent makeup or concentration
  • Help stabilize biomass under both high and low temperature conditions
  • Restore a population of slow growing organisms such as ammonia oxidizing bacteria (AOB) or sulfur oxidizing bacteria
  • Change the biological population to a more favorable microbial distribution - such as filamentous organisms control in conjunction with disinfection

Bioaugmentation - Limitations 
  • Cannot replace treatment time - all bacteria require time & proper F/M conditions to work
  • Bioaugmentation may extend a treatment systems capacity, but cannot fix a grossly overloaded system
  • Sludge wasting will still be required. While sludge volumes and entrapped water often decreases with bioaugmentation, wasting must be done to prevent accumulation of solids and dead cell mass - old sludge
  • Low D.O. is fixed by adding aeration or more efficient aeration equipment - microbes or other chemical additives (other than peroxides) will crate higher D.O.
  • Metal residuals are not controlled by microbes. Also, some xenobiotic materials are not readily degraded and will pass through a standard treatment system.

Reservoir/Dam construction and microbial transformation of mercury into more toxic methylmercury

11/14/2016

 
Let's start by saying metals are problematic pollutants. As such, microbial and environmental chemistry can transform metals into both more toxic or less toxic forms - but the underlying  element remains. Some such as hexavalent chromium (CrVI) can be converted by aerobic microbes into less toxic Cr III improves the environment. But there are other microbial transformations that can pose a problem. A recent article in the NY Times on the Muskrat Falls Dam in Canada shows how a green source of hydroelectricity can impact downstream fisheries. The article 

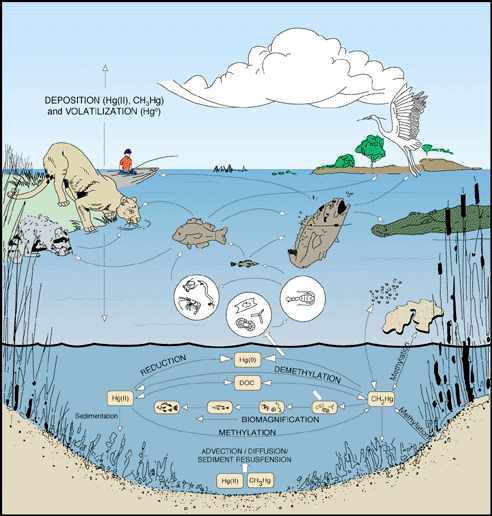
In the case of Muskrat Falls, construction of the dam builds a deep reservoir of water. At the reservoir bottom is organic debris and sediment that undergo slow anaerobic degradation. The reservoir also receives elemental and mercury II from natural sources such as the atmosphere (volcanoes, ocean volatilization) and underlying rocks. Additional mercury comes from human activities such as metal processing, mining, and mainly burning of coal. Most mercury inflow from the environment is in the "less" toxic but still toxic elemental form. When the dissolved mercury enters the anaerobic zone, microbes growing on the organic sediment convert elemental mercury into the more toxic methyl form that is more adsorbed by plants, fish, and all animals eating the fish. Adsorbed methyl mercury bioaccumulates and can cause mercury poisoning in populations depending upon contaminated animals as a food source.

It should also be noted that methyl mercury can be converted by UV radiation and aerobic microbial processes back into elemental form - which is part of the natural mercury cycle. It is the increased amount in mercury entering the cycle in an ecosystem that creates an abundance of methyl mercury.

Below is a great graphic of the mercury cycle from the USGS.

Picture
From https://www2.usgs.gov/themes/factsheet/146-00/

Oxygen Uptake Rates - Should it be run daily?

11/10/2016

 
Oxygen Uptake Rates - both SOUR and DOUR - are easy tests requiring only a BOD bottle, O2 probe, and stir plate/stir bar. Completed with 5 - 10 minutes, the OUR test requires no reagents or special advanced techniques, yet provides critical information on microbial activity and growth rates.

The SOUR is simply the DOUR divided by the MLSS or MLVSS in grams - just make sure you use the same divisor each time as the oxygen uptake rate tests rely on trends rather than a single data point. As the biomass reaches a more "mature" stage - stationary or decline phase growth (all depends on system type), the SOUR decreases. Lower oxygen uptake rate values show the cells do not have excess soluble organics and are not rapidly dividing. However, if you see a high COD and still have a low OUR - it could indicate toxicity or lag phase growth. Neither condition makes for good effluent quality.

For OUR to be a powerful tool, it must be frequently run. Depending upon fluctuations in influent quality or makeup - OUR should be run anywhere from every shift to weekly. The more often it is run, the better the information provided by the test.

By running OURs, a facility can replace the use of expensive equipment such as respirometers or high cost reagent tests for daily monitoring. So remember that while the OUR test is simple and not the latest in technology, it is very useful in monitoring biomass activity.

DOUR Protocol

    Author

    Erik Rumbaugh has been involved in biological waste treatment for over 20 years. He has worked with industrial and municipal wastewater  facilities to ensure optimal performance of their treatment systems. He is a founder of Aster Bio (www.asterbio.com) specializing in biological waste treatment.

    View my profile on LinkedIn

    RSS Feed

    Click to set custom HTML

    Archives

    December 2022
    November 2022
    October 2022
    September 2022
    August 2022
    June 2022
    May 2022
    March 2022
    February 2022
    January 2022
    November 2021
    October 2021
    September 2021
    August 2021
    June 2021
    April 2021
    March 2021
    February 2021
    December 2020
    November 2020
    October 2020
    September 2020
    August 2020
    July 2020
    June 2020
    May 2020
    April 2020
    March 2020
    February 2020
    January 2020
    December 2019
    November 2019
    October 2019
    September 2019
    August 2019
    July 2019
    June 2019
    May 2019
    April 2019
    March 2019
    February 2019
    January 2019
    December 2018
    November 2018
    October 2018
    September 2018
    August 2018
    July 2018
    June 2018
    May 2018
    April 2018
    March 2018
    February 2018
    January 2018
    December 2017
    November 2017
    October 2017
    September 2017
    August 2017
    July 2017
    June 2017
    May 2017
    April 2017
    March 2017
    February 2017
    January 2017
    December 2016
    November 2016
    October 2016
    September 2016
    August 2016
    July 2016
    June 2016
    May 2016
    April 2016
    March 2016
    February 2016
    January 2016
    December 2015
    November 2015
    October 2015
    September 2015
    August 2015
    July 2015
    June 2015
    May 2015
    April 2015
    March 2015
    February 2015
    January 2015
    December 2014
    November 2014
    October 2014
    September 2014
    August 2014
    July 2014
    June 2014
    May 2014
    April 2014
    March 2014
    February 2014

Proudly powered by Weebly
Photos used under Creative Commons from Picturepest, marcoverch, perzonseowebbyra, Picturepest, Picturepest, dsearls, dungodung, Massachusetts Office of Travel & Tourism, aqua.mech, vastateparksstaff, hile, Aaron Volkening, amishsteve, Neil DeMaster, mklwong88, KOMUnews, Picturepest, kaibara87