• Blog
  • Wastewater Testing
  • Bioaugmentation Applications
  • Useful Information
  • About Us
BIOLOGICAL WASTE TREATMENT EXPERT
Contact Us

My F/M ratio is low but my SV30 is good.... what does this mean?

11/30/2015

 
Most engineers want to know which is more important - should they change operations based on F/M or SV30. Well like most wastewater operations, it is not so simple.

First the F/M ratio is often based on MLSS (total solids) or MLVSS (volatile solids). This is the M in the equation. While we often say this is the "bacteria" or "bugs", the real answer is living bacteria cells only represent a percentage of this mass. As we get lower F/M ratios, the amount of living bacteria compared to dead cell mass, biopolymers, and adsorbed organics drops resulting in what we call "old biomass". If the percent of living bacteria cells continues to decline because of limited "food" the amount of biopolymers that hold the floc together begin to decrease and you will see the pin floc associated with old sludge. By looking at the incoming organics (F or Food), the F/M ratio is a forward looking number (even if we use 5 day old BOD5 numbers - as it takes a sludge age (MCRT) or two for within control feed changes to fully impact the biomass.

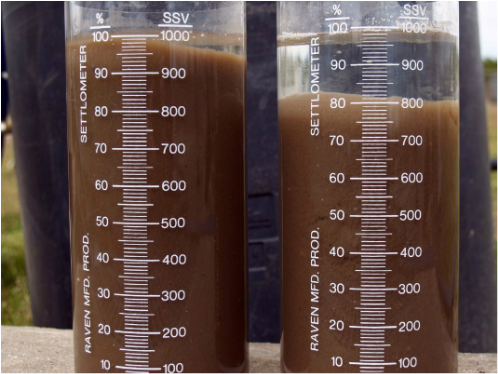
The SV30 test is a picture of current settling rates. It does not predict future performance. Changes made based on SV30 should be made slowly in steps as these changes, with the exception of polymer addition, take time to change the floc structure (SV30's underlying cause).

Therefore, if continued low influent organic loadings creates low F/M and a gradual decrease in the percent active biomass. Eventually this will impact floc structure and lead to pin floc and turbidity in the SV30 if the low influent food concentrations continue. However, do not make big changes in operation based on a few days of low loading as changes take up to two sludge ages to manifest their full impact.

Monitoring Biological Wastewater - why there is no one "idea" or "target" indicator/test result value that is universal to all systems

11/17/2015

 
Picture
Face it, biological waste treatment units have a lot of variation in influent concentration and chemical composition, not to mention variation in temperature, pH, alkalinity, etc.

Increasing the operational challenge is the reliance on living organisms that are in a constant state of flux to transform the wastes via multiple metabolic pathways into harmless forms. As any home baker or home brewer can tell you - even adding exact yeast cultures to set carbon sources can have a lot of variation in results.

The great amount of variation in both the influent makeup and biological population along with the plethora of system setups (referring to layout, retention times, aeration efficiency, clarifiers etc), results in no perfect, universal target monitoring test numbers that work on all systems. When I work with a new system, I give 'rule of thumb' ranges for normal values based on facilities with similar influent and systems (which is some cases is not easy to find).

It is this lack of a single ideal number or indicator that makes frequent monitoring important for predicting effluent quality based on collected test data. The minimum tests I recommend for activated sludge include SV30, MLSS, secondary clarifier bed depth, microscopic exam of MLSS, influent/effluent BOD/COD, and checking dissolved oxygen in biological unit. Other tests such as ammonia, nitrate/nitrite, phosphate, or specific pollutants can be done.

In starting a new system or treating a new influent, the more data collected the better we can understand how additions, modifications, or changes in influent strength will impact the system. All of this can result in lower, long term treatment costs.

What is my ideal Sludge Volume Index (SVI) number?

11/12/2015

 
Picture


We often generate SV30 and SVI numbers in our monitoring - but rarely think about how to interpret the number. Remember the SV30 test is designed to predict secondary clarifier performance in suspended growth systems (normally activated sludge). While usually overlooked, I as operators questions about supernatant turbidity & fines remaining after the sludge settles. Additionally, does the sludge float after sitting for 2 hours due to denitrificiation? Another issue could be fats, oils, and grease causing a scum (floating sludge)  layer on the top after 30 minutes.

For general guidance on how SVI relates to sludge settling characteristics:

SVI (ml/g)                         Sludge Settling & Compacting Characteristics
< 80                                    Excellent - but can leave "fines" if sludge age is too long
80 - 150                              Normal zone - I usually suggest targeting 100 - 120 for best water
> 150                                  Poor settling - need to check for filaments or less likely viscous bulking

Nutrient removal from wastewater - new challenges

11/9/2015

 
Due to acute toxicity to aquatic organisms, wastewater permits have long required removal of ammonia nitrogen from wastewater. This process normally relies on Ammonia Oxidizing Bacteria (AOB) which are organisms that derive energy from the conversion of ammonium (NH4) into nitrite (NO2) and finally nitrate (NO3). The focus was to achieve full conversion to nitrate as the nitrite form was also toxic. Later in developing more advanced treatment, the nitrate/nitrite were to be removed via the denitrification process.

Many common wastewater organisms are capable of removing nitrate/nitrite from waste when dissolved oxygen falls to zero (redox potential <0) in the presence of soluble organics (we often term this BOD5). The process relies on the ability of the bacteria to harness the oxygen bound in the nitrate/nitrite when consuming soluble organics. The BOD5 is lowered and nitrate/nitrite are converted to carbon dioxide (CO2) and nitrogen gas (N2). We see this in the small bubbles that float sludge in secondary clarifiers with long residence times and deep sludge beds. It is also seen in settling ponds where in warm weather we have small nitrogen bubbles along with other anaerobic gasses.

Now that we have converted nitrogen in water to gas, another problem nutrient remained in the wastewater for treatment - Phosphorus. While not directly toxic, in most freshwater an excess of phosphate can trigger algae blooms. The algae bloom causes pH and dissolved oxygen swings and in the case of many cyanobacteria can result in toxic byproducts. To remove phosphate multiple technologies were developed including using alum and other chemical binding/solids removal technologies. These require both equipment, operator input, and produce sludge for disposal. Another option explored was to use the natural tendency of bacteria to uptake phosphate into the cell during growth. in nature phosphate is often a limiting nutrient, so when presented with high phosphate levels, bacteria tend to store phosphate for later use. After much testing, a biological process to remove phosphate was optimized. To encourage the best phosphate uptake, requires the use of a anaerobic zone at the inlet where organisms release stored phosphate to move soluble BOD across the cell wall and start anaerobic metabolism. This gives the phosphate storing cells an advantage when they get to an aerobic zone where all bacteria work efficiently. With oxygen plentiful, the Bio-P organisms, phosphate accumulators, uptake excess phosphate into their cells. This fixes free soluble phosphate into the biological solids. For removal of phosphate from the effluent, TSS or biological solids needs to be removed. A big requirement of biological phosphate removal is to keep the phosphate in the cells - which means no anaerobic storage conditions prior to discharge as this starts the natural phosphate release process.

Aerobic vs anaerobic which is better for waste treatment?

11/5/2015

 
Picture
I have a list of Pros & Cons that I cover with people. This list contains the most common talking points we need to evaluate before selecting a treatment technology. Of course there are many other factors in making the treatment decision, and in many cases a combined anaerobic/aerobic system can often be the best option.


Aerobic Systems

Pros
  • Can treat moderate COD waste < 2,000 mg/L more efficiently
  • Better removal of fats, oils & grease
  • Ammonia oxidation (ammonia removal)
  • Good for many xenobiotic compounds
  • Less susceptible to low temperatures
Cons
  • More biosolids produced per unit of COD removed
  • Higher electricity costs for aeration
  • Not as efficient at treating high soluble COD loadings

Anaerobic System (with methane production)
Pros
  • Low biosolids production (a full magnitude lower)
  • Methane can be used to maintain heat for digester & potentially provide some excess power
  • Low energy costs
  • Very stable once established
  • Less susceptible to heavy metals
  • Smaller footprint
Cons
  • Works best with concentrated COD wastes
  • COD needs to be mostly fermentable materials (Fats & oils can cause problems in excess)
  • Outside design temperature range conditions can stop methane formation
  • More expensive to construct
  • Does not remove nutrients (ammonia & phosphate)

This list is by no means exhaustive, what parameters can you see adding to the list?

Soil Bioremediation of Petroleum Hydrocarbons

11/2/2015

 
Picture
Spills can occur when handling petroleum products at loading facilities, tank farms, and in production areas. Often soils in the area can become contaminated with hydrocarbon. The contaminated soils can be physically removed for off-site disposal or treatment. However, this is expensive and can disrupt normal work being performed in the area.

One of the least used by most attractive cleanup options is to use in-situ bioremediation to cleanup the spill. First, the site must be evaluated to ensure that all free petroleum products are removed to prevent the product from escaping in run-off from the site. The remaining soil, while contaminated, actually contains the hydrocarbons on the site. Instead of excavating the soil, the facility can apply a combination of nutrients, bio-compatible surfactants, and petroleum degrading microbial consortium to ensure rapid removal of remaining hydrocarbons on the soil.

An example of this approach was done in a tank farm with hydrocarbons accumulation in the working area. The area for the test was 120 feet x 70 feet and ran parallel to the pipe racks from the tank area. Since only a portion of the oil-contaminated area was to be treated, daily visual comparisons were convenient. Bench scale studies were initiated to analyze soil conditions and determine what changes would have to be made to rapidly degrade the oil in the soils present.
 
Contractors used a combination of fertilizer, biodegradable surfactants and bioaugmentation cultures to treat contaminated soils.  Since the contamination was only in the upper 8 - 10 inches of soil, treatment via surface spray application was deemed sufficient for in-situ remediation.  Fertilizer was added to give 120 ppm nitrogen and 30 ppm phosphorus. This fertilizer dose was based upon contamination (TPH) levels averaging 2,400 mg/kg.
 
After two weeks, the treated areas showed significantly less oil contamination as determined by visual inspection. The soil nutrient levels were checked and moisture was maintained at 30 – 40%.  Visual observations were confirmed by laboratory testing which indicated average oil content dropping from 2,400 mg/kg to 550 mg/kg in the first 14 days of the project.  After four weeks the contamination was only visible in vegetated areas with the overall average oil concentrations being 40 mg/kg.

    Author

    Erik Rumbaugh has been involved in biological waste treatment for over 20 years. He has worked with industrial and municipal wastewater  facilities to ensure optimal performance of their treatment systems. He is a founder of Aster Bio (www.asterbio.com) specializing in biological waste treatment.

    View my profile on LinkedIn

    RSS Feed

    Click to set custom HTML

    Archives

    December 2022
    November 2022
    October 2022
    September 2022
    August 2022
    June 2022
    May 2022
    March 2022
    February 2022
    January 2022
    November 2021
    October 2021
    September 2021
    August 2021
    June 2021
    April 2021
    March 2021
    February 2021
    December 2020
    November 2020
    October 2020
    September 2020
    August 2020
    July 2020
    June 2020
    May 2020
    April 2020
    March 2020
    February 2020
    January 2020
    December 2019
    November 2019
    October 2019
    September 2019
    August 2019
    July 2019
    June 2019
    May 2019
    April 2019
    March 2019
    February 2019
    January 2019
    December 2018
    November 2018
    October 2018
    September 2018
    August 2018
    July 2018
    June 2018
    May 2018
    April 2018
    March 2018
    February 2018
    January 2018
    December 2017
    November 2017
    October 2017
    September 2017
    August 2017
    July 2017
    June 2017
    May 2017
    April 2017
    March 2017
    February 2017
    January 2017
    December 2016
    November 2016
    October 2016
    September 2016
    August 2016
    July 2016
    June 2016
    May 2016
    April 2016
    March 2016
    February 2016
    January 2016
    December 2015
    November 2015
    October 2015
    September 2015
    August 2015
    July 2015
    June 2015
    May 2015
    April 2015
    March 2015
    February 2015
    January 2015
    December 2014
    November 2014
    October 2014
    September 2014
    August 2014
    July 2014
    June 2014
    May 2014
    April 2014
    March 2014
    February 2014

Proudly powered by Weebly
Photos used under Creative Commons from Picturepest, marcoverch, perzonseowebbyra, Picturepest, Picturepest, dsearls, dungodung, Massachusetts Office of Travel & Tourism, aqua.mech, vastateparksstaff, hile, Aaron Volkening, amishsteve, Neil DeMaster, mklwong88, KOMUnews, Picturepest, kaibara87