• Blog
  • Wastewater Testing
  • Bioaugmentation Applications
  • Useful Information
  • About Us
BIOLOGICAL WASTE TREATMENT EXPERT
Contact Us

MLSS vs MLVSS - which is best for operating a wastewater treatment plant?

1/31/2018

 
Short post - but I am often asked about MLSS vs MLVSS and which is required to operate a wastewater treatment plant. As with most things wastewater - consistency is actually more important that the individual test. Remember, for wastewater operations we are looking for trends so running the same test each time is important for data analysis and operational decisions. Now for MLSS vs MLVSS.

MLSS - is the biological and inorganic solids dried at 105 Deg C. So we just remove the water from the solids. 

MLVSS - we take the dried sample from MLSS testing and put in a high temperature furnace 550 Deg C. This removes the volatile portion of the MLSS, which is all of the biological portion - cells, EPS, insoluble organics, etc. Leaving the inorganic fraction. so MLSS - Residual after 550 Deg C = MLVSS.

In all cases MLSS >​ MLVSS.

For WW, I work with plants that use MLSS, MLVSS, or both. Just use the same test for operation decisions and don't get into data paralysis.

Reactor mixing - Complete Mix, Plug Flow, & Hybrid - what we see in the real systems versus text book

1/18/2018

 
Picture
​
Picture

We often discuss water treatment systems as complete-mix (CSTR), plug flow (PFTR), or hybrid (this includes multiple CSTR). In the real world of waste treatment systems we rarely find pure complete mix or plug flow systems. An Batch Reactor (SBR) is a common true CSTR, along with the large single, highly mixed tank based activated sludge units found in chemical industries where influent dilution is important.

Systems such as oxidation ditches, aerated basins, and systems like the diagram above (left) are called plug flow which is not usually the correct model. For a true plug flow system, the water and solids move in one direction, without back-mixing. The action of mechanical aeration, diffusers, mixers, and even friction with walls creates back-mixing in most of these systems. This back-mixing creates a flow pattern simulated by multiple CSTRs (the area around each mixing zone becomes an in-basin CSTR). As the number of CSTRs increases (smaller CSTRs in series), tracer studies show more of a plug flow peak for effluent tracer concentration. 

Can ammonia be higher than TKN in wastewater?

1/15/2018

 
The answer is ----- NO. 

The reason TKN is always is higher than ammonia is related to what the test does. TKN or Total Kjeldahl Nitrogen uses sulfuric acid & catalysts to convert organic nitrogen to ammonia/ammonium. So in the digestion step - we have organic nitrogen such as proteins and amines being converted to ammonium (the digestion step is an acid where ammonia exists as ammonium). The test does not measure nitrate, nitrite, azo groups or nitrogen in ring structures.

Once digested - the sample pH is increased and tested for ammonia. The reading from the sample is total nitrogen. A non-digested sample is also tested for ammonia (using ISE or other ammonia testing method). The non-digested sample gives the ammonia/ammonium concentration.

TKN = total nitrogen (organic nitrogen converted to ammonium in acid digestion step)
Ammonia = increase pH to convert ammonium into ammonia - then read ammonia concentration

TKN - Ammonia = Total Organic Nitrogen (this gives the potential ammonia that can be released as organisms degrade proteins, amines, and other forms of organic nitrogen). Total Organic Nitrogen is abbreviated to TON. 

How can a lab have higher ammonia than TKN - it could be error in testing. Or dilution factors required for testing make the error term larger than the difference in TKN/Ammonia - this would require the sample contain mostly ammonia with little organic nitrogen.

Using Environmental Genomics - 16s rDNA testing - to identify key microbial genera in petrochemical wastewater treatment plants

1/8/2018

 
Picture
The wastewater treatment plant microorganisms, often called biofilm, MLSS or MLVSS, depend upon influent composition, biological treatment unit environmental conditions and treatment plant operations. Aster Bio’s research suggests that a core microbial group is present in most designs for extended aeration treatment systems. Via routine monitoring for key microbial genera, Aster Bio can detect the impact of new influents and operational changes at the microbial level. By closely monitoring changes in biomass microbial composition, WWTP do not rely on trailing indicators for tracking biomass health.

At Aster Bio, we have been working hard to understand what these different communities look like by harnessing our Environmental GenomicsTM platform for microbial community analysis using high- throughput 16S rRNA gene sequencing. Petroleum refining and organic chemical industries have quite variable influent compositions. While many wastewater plants treat both petroleum refining and organic chemical wastewaters, we break the group into two segments:
  • Petrochemical Refinery – hydrocarbons, aromatics, phenol, and amines at mesophilic temperatures and relatively neutral pH. Process units centered around producing fuels, lubricants, and high-volume intermediate organic chemicals.
  • Organic chemical Production – hydrocarbons, aromatics, amines at mesophilic temperatures and relatively neutral pH. Process units commonly include olefins, specialty organic compounds, and finished marketable products.
In these systems, we have found a group of "core four" microbial genera:
  • Thauera
  • Hyphomicrobium
  • Nitrospira
  • Nitrosomonas
​The first two are facultative organisms that use dissolved oxygen and nitrate/nitrite as electron acceptors while degrading influent organic compounds. As petrochemical and organic chemical plants often require ammonia oxidation, we note consistent populations of AOB/NOB composed of Nitrosomonas and Nitrospira. These genera convert ammonia via nitrite to nitrate – while using carbonates and carbon dioxide as the primary carbon source for cellular materials. These four microbial genera make up a very significant portion of the biomass in MLSS, often 25% or more. We also find significant quantities of Achromobacter, Bacillus, Burkholderia, and Pseudomonas genera present.
​

But beyond this core group, the source influent and operating conditions impact the MLSS microbial composition. Systems with lower MCRT select against slower growing organisms such as Nitrosomonas and Nitrospira. Petrochemical facilities including olefin wastewater encourages the growth of Methyloversatilis, a group that thrives on C1 and other common hydrocarbon compounds. Other significant microbial genera found inside WWTP treating integrated petrochemical wastewater include Variovorax, Candidatus symbiobacter, Edwardsiella, Ottowia, Massilia, Aromatoleum, Immundisobacter, Limnohabitans, Rododbacter, Azoarcus, Azospirillum, and Cupriavidus.
​

Interestingly, even with samples taken from aeration basins with dissolved oxygen above 2.0 mg/L, we find microorganisms that are either strict anaerobes like Clostridia, or require anoxic conditions to denitrify, like Thauera and Hyphomicrobium. Longer sludge ages, lower F/M, and high biological solids tend to increase the number of anaerobic and facultative anaerobic cultures. Both groups are favored by the internal floc or lower levels of the biofilm where the microbes are not exposed to the dissolved oxygen found in the surrounding water. Additionally, as the amount of inorganics and insoluble organics increase as a fraction of the MLSS, we see a shift to anaerobic and facultative anaerobic cultures as oxygen transfer efficiency into the floc decreases. 

Using Environmental Genomics ™ - Aster Bio's Environmental 16s rDNA testing platform - to evaluate wastewater treatment plant biomass

1/5/2018

 
Most wastewater monitoring looks at secondary indicators of biomass health. While useful, there is a time delay before changes in biomass result in settling or removal efficiency. How do you look at the microbes inside the MLSS or biofilms? Ten years ago, the answer was usually plate counts or early DNA testing methods that required culturing separate isolates and long testing times. Advances in technology have made high throughput DNA analysis of mixed cultures possible since 2010. As the science has improved equipment and databases, improved analytical technology is available. For the past three years, Aster Bio has been making extensive use of 16s rDNA testing to determine the natural microbial makeup of various wastewater treatment plants. We have built our own database of microbes found in various industrial wastewaters and how they drift during operational changes and periods of stress.

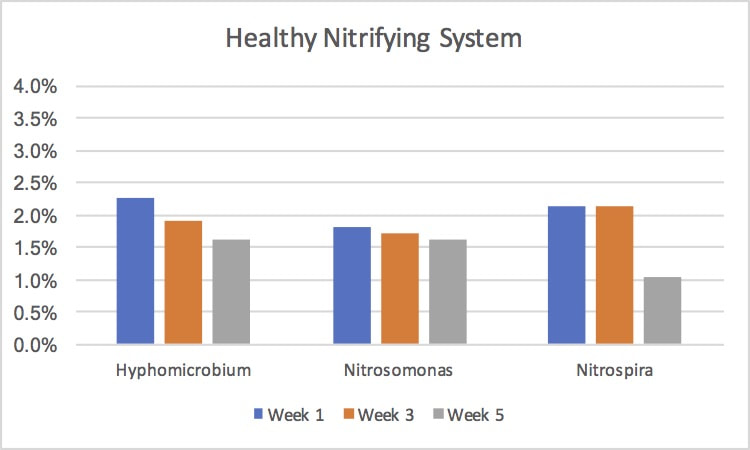
Below is an interesting data set for Ammonia Oxidizing Bacteria (AOB) - often called nitrifiers, the AOB convert ammonia into nitrite and are vital for permit compliance. The Environmental Genomics testing gives each genera as a % of the total biomass. We took three time series samples in an industrial extended aeration activated sludge unit that was operating at target treatment efficiencies.

Picture

Multicellular indicator organisms is their presence a good sign?

1/2/2018

 
Microscopic exam is a good way to survey biomass health in suspended growth systems. Conventional and extended aeration activated sludge systems are designed to operate at decline to endogenous phase on the growth curve. Protozoa indicative of good operating conditions include free-swimming ciliates, crawling ciliates, and stalk ciliates/suctorians. All of these protozoa are single cell organisms associated with floc formation and sufficient dissolved oxygen. As we move further into endogenous phase - lower F/M and longer MCRT - we start to see multicellular organisms in the MLSS. The most common being rotifers - these organisms are very common in large lagoon systems, fixed film, and activated sludge with low loadings. As we increase populations of rotifers and start seeing worms, tardigrades, and gastrotrichs, the polymers holding the floc together start to "digest" inside the aeration basin. In effect, the aeration basin becomes an aerobic digester. The multicellular indicators need higher dissolved oxygen and lower F/M conditions than the single cell protozoa - and thrive in extreme low F/M conditions. So what can be the problem when multicellular organisms predominate over protozoa? 
  • Floc begins to fragment - smaller floc
  • "Fines" begin to be seen in the water column and on top of the clarifier
  • Effluent turbidity increases 
  • Polymer demand increases to prevent solids carryover
  • Viable portion of the biomass decreases as MLSS becomes more "dead" biomass and particulates
The above conditions indicate "old sludge" and the solution is to increase wasting. Lowering MLSS increases the F/M, lowers MCRT - which increases EPS (biological polymers) and number of viable bacteria.

    Author

    Erik Rumbaugh has been involved in biological waste treatment for over 20 years. He has worked with industrial and municipal wastewater  facilities to ensure optimal performance of their treatment systems. He is a founder of Aster Bio (www.asterbio.com) specializing in biological waste treatment.

    View my profile on LinkedIn

    RSS Feed

    Click to set custom HTML

    Archives

    December 2022
    November 2022
    October 2022
    September 2022
    August 2022
    June 2022
    May 2022
    March 2022
    February 2022
    January 2022
    November 2021
    October 2021
    September 2021
    August 2021
    June 2021
    April 2021
    March 2021
    February 2021
    December 2020
    November 2020
    October 2020
    September 2020
    August 2020
    July 2020
    June 2020
    May 2020
    April 2020
    March 2020
    February 2020
    January 2020
    December 2019
    November 2019
    October 2019
    September 2019
    August 2019
    July 2019
    June 2019
    May 2019
    April 2019
    March 2019
    February 2019
    January 2019
    December 2018
    November 2018
    October 2018
    September 2018
    August 2018
    July 2018
    June 2018
    May 2018
    April 2018
    March 2018
    February 2018
    January 2018
    December 2017
    November 2017
    October 2017
    September 2017
    August 2017
    July 2017
    June 2017
    May 2017
    April 2017
    March 2017
    February 2017
    January 2017
    December 2016
    November 2016
    October 2016
    September 2016
    August 2016
    July 2016
    June 2016
    May 2016
    April 2016
    March 2016
    February 2016
    January 2016
    December 2015
    November 2015
    October 2015
    September 2015
    August 2015
    July 2015
    June 2015
    May 2015
    April 2015
    March 2015
    February 2015
    January 2015
    December 2014
    November 2014
    October 2014
    September 2014
    August 2014
    July 2014
    June 2014
    May 2014
    April 2014
    March 2014
    February 2014

Proudly powered by Weebly
Photos used under Creative Commons from Picturepest, marcoverch, perzonseowebbyra, Picturepest, Picturepest, dsearls, dungodung, Massachusetts Office of Travel & Tourism, aqua.mech, vastateparksstaff, hile, Aaron Volkening, amishsteve, Neil DeMaster, mklwong88, KOMUnews, Picturepest, kaibara87