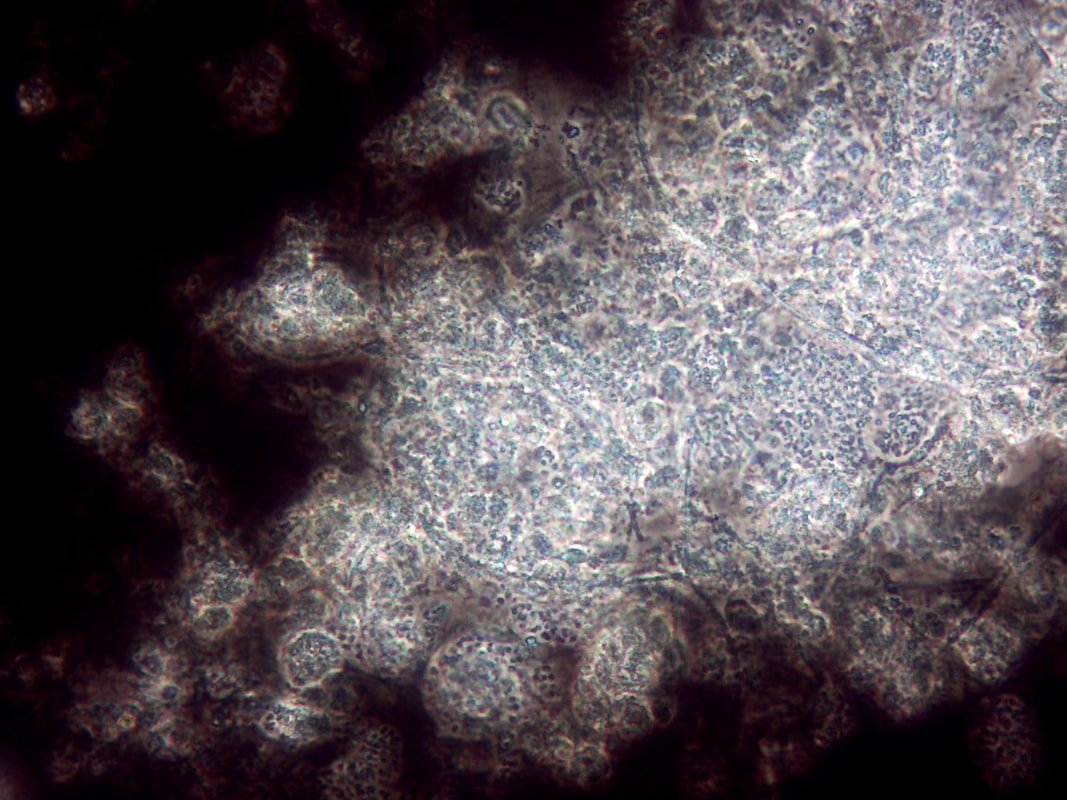
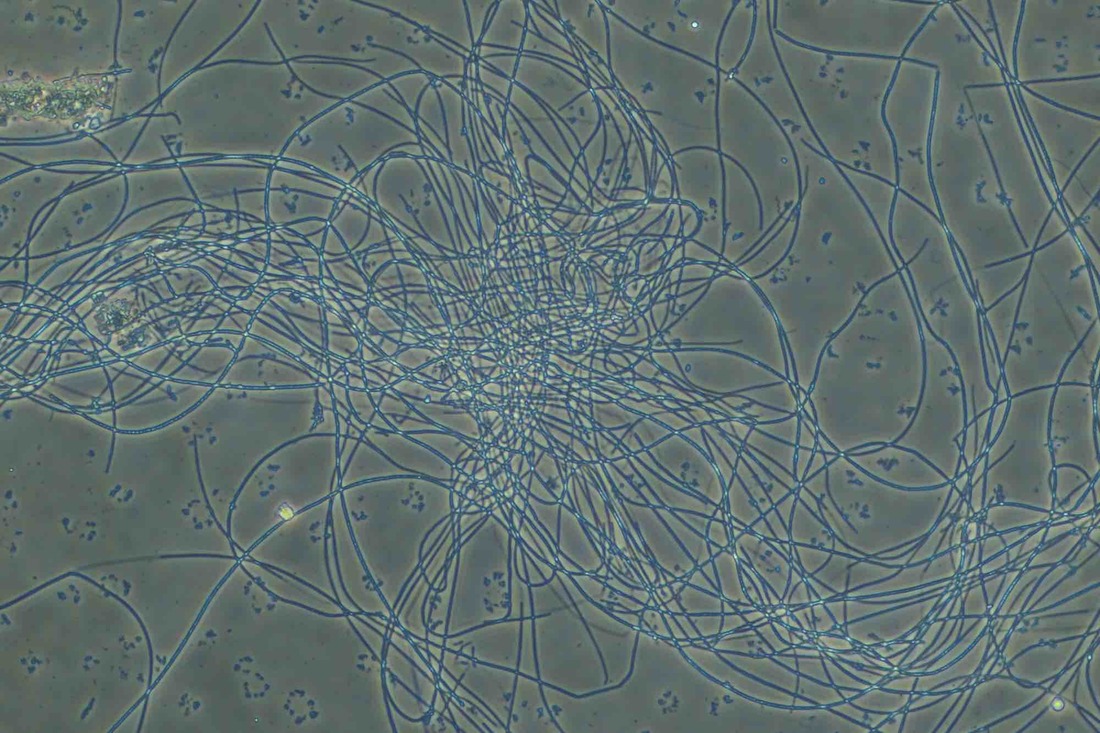
Non-filamentous bulking in wastewater treatment plants (WWTPs) can be a challenging issue, affecting the quality of the final effluent. In the photo above, note the rounded colonies that appear to have more "gel" between the cells - these are high EPS zones. Also, the above photo is using India Ink. The carbon particles in the ink do no penetrate high EPS floc which proves that you have excess EPS and non-filamentous bulking. Let’s explore strategies for controlling this phenomenon:
- Understanding Non-Filamentous Bulking:
- Filamentous bulking occurs due to excessive growth of filamentous bacteria in WWTPs.
- Ideally, there should be a balance between filamentous bacteria and floc-forming bacteria.
- In moderate amounts, filamentous bacteria contribute to AS settle-ability by providing a structural base for robust floc formation.
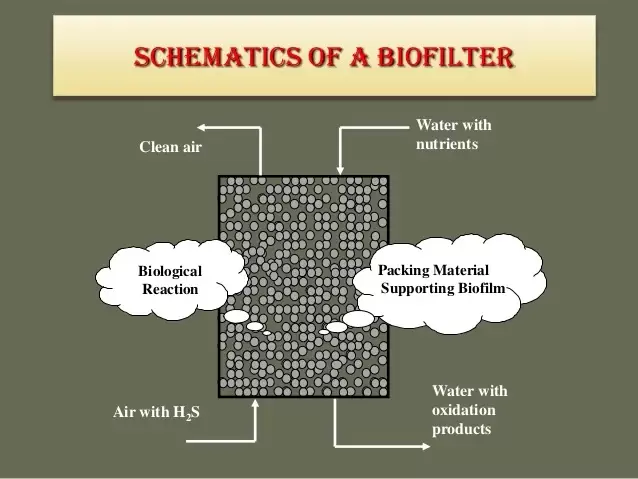
- The Role of EPS (Extracellular Polymeric Substances):
- EPS is crucial for floc formation in suspended growth and biofilms.
- It consists of polysaccharides, proteins, nucleic acids, and metabolic byproducts.
- EPS protects cells and accumulates nutrients (N, P, metals).
- Proper EPS levels are essential for solids removal and phosphate removal.
- The Transition to Excess EPS:
- Excess EPS leads to problems:
- Waste solids retain more bound water.
- Dewatering becomes difficult.
- Secondary clarifiers may have floating scum and poor compaction.
- Major contributors to non-filamentous bulking:
- Thauera: Common in industrial activated sludge.
- Zooglea: More common in domestic wastewater.
- Azoarcus: Less common but efficient denitrifiers.
- Excess EPS leads to problems:
- Control Strategies:
- Nutrient Adjustment:
- Turn up nutrients (N or P) if not already optimal. If C:N:P ratio is in the target zone, adding additional nutrients will not help with bulking.
- Waste Solids Management:
- Remove excess EPS through waste activated sludge (WAS).
- Be cautious as it increases the F/M ratio.
- Bioaugmentation:
- Increases viable microorganisms in the mixed liquor suspended solids (MLSS) breaking bottlenecks created by overgrowth of high EPS producing organisms.
- Aster Bio has identified and produced cultures having the ability to degrade EPS via extra-cellular enzymes and form beneficial capsular polymers that function much like chemical cationic coagulants.
- Nutrient Adjustment:
- Monitoring and Early Detection:
- Use molecular tests including qPCR to detect changes in Zooglea populations.
- Look for signs of increased soluble BOD loadings at the influent.

 RSS Feed