• Blog
  • Wastewater Testing
  • Bioaugmentation Applications
  • Useful Information
  • About Us
BIOLOGICAL WASTE TREATMENT EXPERT
Contact Us

When a known filamentous bacteria does not form a bulking filament. A case to explain phenotype vs genotype.

6/27/2018

 
Picture
If you were to watch a dog show, it is easy to be astonished by the differences in size, color, shape, and overall appearance of dogs. All the contestants are from the same species, or same genotype. What is different is the outward characteristics or phenotype. While dogs are a great example, every living species has some variation in appearance which is phenotypical variation.

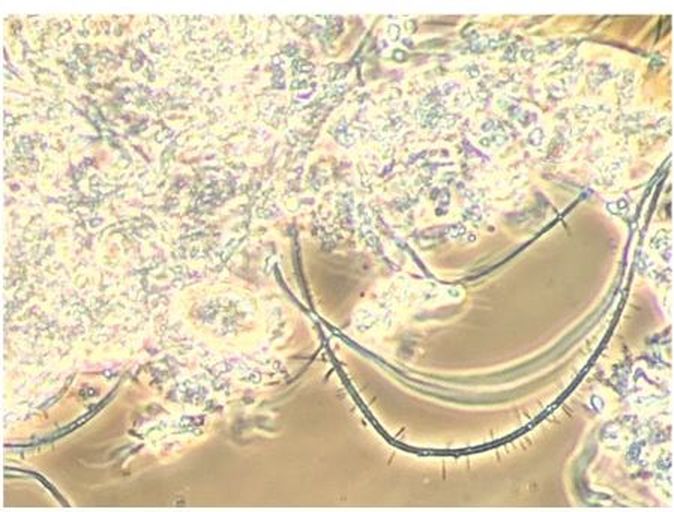
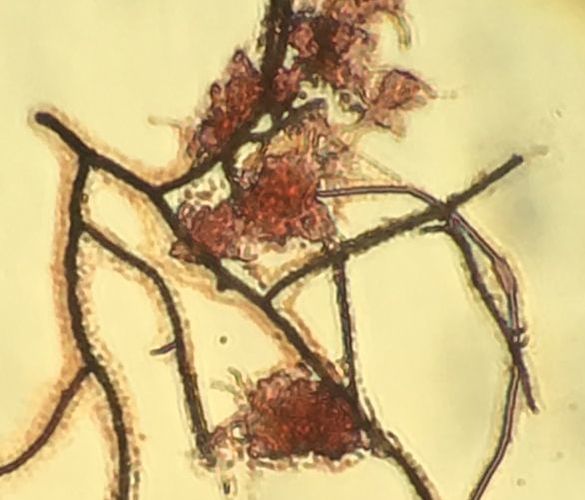
Now to filamentous bacteria in wastewater. Some filamentous bacteria can also exhibit non-filamentous growth or life stages. It is only under certain conditions such as low dissolved oxygen or low nutrients that we get the change into filamentous growth patterns. We have been doing work on S. natans which is known to be responsible for many filamentous bulking events. However we are finding S. natans in non-filamentous growth form. This is a microbial example of the same genotype - which reads the same under DNA testing - having a very different outward appearance or phenotype. Other problematic organisms such as Nocardia can also exhibit the same switch from beneficial growth into problem forms under varying environmental conditions.  

With our continued DNA based microbial community analysis and qPCR MLSS testing, Aster Bio's Environmental Genomics platform is giving our customers a deep understanding of how genotype and phenotype changes in MLSS can effect wastewater treatment efficiency.

Improving wastewater filamentous bulking ID, monitoring, and control using qPCR

6/19/2018

 
Picture

Paul Campbell leads Aster Bio's molecular diagnostics development projects. Today, he is discussing our efforts to detect and quantify filamentous bulking organisms in wastewater.

Wastewater treatment operators have been using microscopic examinations of their sludge for decades. These operators are accustomed to describing what they see under the scope in qualitative terms such as:

* Gram stain – positive or negative
* Neisser stain – positive or negative
* Eikelboom morphotype 0914 or Type 1701, etc.

Aster Bio is developing genetic tests based on qPCR to follow key microorganisms in wastewater. And... guess what? It is not always easy to tie genetics to microscopic observations, for several good reasons. But, does this mean that one method is superior to the other? No, but it does mean that, with time, you can correlate the data provided by each method with the system under observation. In this regard, qPCR and other molecular methods have a little catching up to do. We are rapidly collecting data to bridge this gap.

So, why the differences?

First, we are dealing with two completely different types of data. With experience, microscopic exam provides a very consistent, descriptive analyses of what is on a slide. Results of different stains are fairly objective, as are measurements of cell sizes, filament diameters, and types of branching. But it is difficult to objectively (or subjectively) estimate the microbial populations in percentages. And worse yet, biology can throw you a curve ball (more on that below).

In contrast, a method like qPCR is very objective with one caveat: once you decide on a protocol, you need to stick with it (or spend a lot of time recalibrating between the old and new protocol). It is very quantitative (hence the "q" in qPCR). But, again, biology can throw you a curve ball here, too.

So, what are these curve balls? Genotype (genetic composition) v. Phenotype (physical appearance)

The phenotype of a microorganism can change drastically, impacting microscopic exam interpretation. For example, Sphaerotilus natans, a notorious wastewater filament, has demonstrated different growth patterns depending upon environmental conditions. With sufficient oxygen present, the cells generally act as individuals, living a planktonic lifestyle. But, as the dissolved oxygen drops, the planktonic cells begin to grow as sheathed filaments.

Phenotype can also impact a genetic assay like qPCR! Several floc-forming microorganisms produce extracellular DNA that increases their relative count number during qPCR testing. (Same number of individual cells but extra free DNA copies making DNA-based overcounts possible). Extracellular DNA overcounts are possible with microorganisms like Thauera (a key denitrifying genus that is also associated with non-filamentous bulking) and Nitrospira (ammonia-/nitrite-oxidizing bacteria) that uses extracellular DNA to reinforce the floc.
​
As Aster Bio expands our qPCR testing portfolio and adds more information to our genetic database, we will offer wastewater treatment plants a rapid, truly quantitative way to identify and troubleshoot filamentous bulking and non-filamentous (often called Zoogleal bulking) events. The goal is to identify and correct potential problems before the bulking becomes a visible problem using traditional microscopic exam.

How can I have low Dissolved Oxygen filaments when I my DO meter reads > 3 mg/L DO?

6/13/2018

 
With Aster Bio's increased work with molecular biomass testing (Environmental Genomics), we have found obligate anaerobic cultures in systems with DO meters reading above 3.0 mg/L in the aeration basin. How can this happen?

It is all about the biological solids - floc or biofilm. The graphic below represents MLSS from an aerobic granular sludge facility which is a most extreme case of aerobic/anoxic/anaerobic zones in a biofilm. However, depending upon your solids concentration, floc size, and biological polymer matrix - you can have similar environments in an extended aeration activated sludge or MBBR system. So while the water column may have a DO > 3.0, oxygen does not diffuse throughout the floc which enables anaerobic cultures to thrive inside. We have also noted that increased particulates in older sludges can increase the anaerobic effect - another reason to maintain a proper F/M or sludge age by wasting.
Picture

Algae - can bioaugmentation help?

6/6/2018

 
Water retention and stormwater reservoirs serve a vital function in controlling flooding and preventing pollutants from reaching surrounding natural waterways. The runoff contains some blend of the following pollutants:
  • Plant debris (grass clippings, weeds, mulch) - all high in cellulosic materials
  • Fertilizers - both nitrogen & phosphorus
  • Pesticides & herbicides - from gardens
  • Hydrocarbons including oil & fuels - parking lot runoff
  • Untreated wastewater can happen especially during flood events
​What are the treatment options:
  • Add mixers and aeration - this is key to successful reservoir management with all pollutants. This should be the first step -  especially in low flow/mixing reservoirs.
  • Keep pollutants out - either physical or planted barriers mimic natural wetlands that filter pollutants prior to entering water bodies.
  • If algae blooms are still a problem, you can add biological/chemical controls.

Biological & chemical algae controls
  • Copper sulfate - most common low-cost way to control an algae bloom. Effective, but you only want to use during most severe blooms.
  • Dyes to inhibit photosynthesis - not attractive and expensive.
  • Bioaugmentation - using natural water heterotrophic bacteria to degrade pollutants can be a way to improve water quality. Added bacteria help maintain populations required to degrade influent carbon pollutants (measured by COD/BOD). These same bacteria also use nitrogen and phosphorus during growth, thereby removing algae promoting nutrients from the water column. 
​
What to expect from a biological additives in an algae control program
Biological cultures help remove buildup of organics such as hydrocarbons and plant debris. With mixing and aeration, you should notice a reduction in sludge volumes and improved water clarity. The cultures are very effective in lagoons with the most eutrophic conditions. In degrading organic pollutants, you should start to see increased D.O. and lower odors. If the problem is not as much pollution and more algae blooms, you should notice lower copper sulfate or algaecide usage rates.

Overall, I don't see adding biological cultures as a single product fix for eutrophication or algae blooms. It is best to combine multiple technologies to achieve best control.

The bacteria responsible for most ammonia and nitrite removal in wastewater treatment systems - new data

6/1/2018

 
In most of my training and consulting materials, I have spoken of nitrification as a combination of two distinct microbial genera - Ammonia oxidizing Bacteria (AOB) and Nitrite Oxidizing Bacteria (NOB) - which were normally listed as Nitrosomonas sp. (AOB) and Nitrobacter sp. (NOB). Other genera were mentioned but considered secondary (if ever mentioned). The organisms and reactions are given below: 
Picture
What we have been teaching is not exactly correct in most wastewater systems! With more advanced genetic testing, we have found that most chemoautotrophic nitrification is being done by Nitrospira sp. which can do both steps. Therefore, Nitrospira can be thought of as AOB & NOB cultures. Nitrosomonas are much less common (lower percentage of total reads in testing). 

No matter which organisms are removing ammonia and nitrite, the following checklist comes from working wastewater treatment plants that achieve ammonia and nitrite oxidation.
  • Typically in the field 70-80% organic reduction should have occurred prior to trying nitrification.  Usually COD levels at effluent should be 100-150 mg/L while BOD < 40 mg/L.
  • The majority of organics must be degraded since the biomass contains 93-97% heterotrophs and 3-7% chemoautotrophs.  Thus, if high carbon content is present, the heterotrophic organisms will out-compete the slower growing autotrophic nitrifying bacteria for essential nutrients.
  • Rule of Thumb:  As the BOD:TKN ratio decreases, nitrification kinetics increase.
  • Dissolved Oxygen (DO) is vitally important.  Although critical DO (in vitro) is 0.2 mg/L, field DO should never drop below 0.5 mg/L.  Optimal range is >2.0 mg/L for no inhibition whatsoever. 
  • The oxygen required to oxidize 1 gram of NH3-N to NO2-N is approximately 3.5 grams O2.  From NO2-N to NO3-N, it is 1 gram of O2 per gram of NO2-N.

Activated Sludge
pH                                                      6.5-8.5, 7.2 - 7.8 is optimum for MLSS
Temperature                                        10 - 38 Deg C, 30 Deg C optimum
Effluent BOD5                                    < 30 mg/L
Effluent COD                                     <100-150 mg/L
Effluent TOC                                      <45 mg/L
MLSS                                                 2,500 mg/L
Sludge Age (MCRT)                             5 - 15 days
DO                                                    >2.0 mg/L, 2.0 - 4.0 in systems subject to shock         

    Author

    Erik Rumbaugh has been involved in biological waste treatment for over 20 years. He has worked with industrial and municipal wastewater  facilities to ensure optimal performance of their treatment systems. He is a founder of Aster Bio (www.asterbio.com) specializing in biological waste treatment.

    View my profile on LinkedIn

    RSS Feed

    Click to set custom HTML

    Archives

    December 2022
    November 2022
    October 2022
    September 2022
    August 2022
    June 2022
    May 2022
    March 2022
    February 2022
    January 2022
    November 2021
    October 2021
    September 2021
    August 2021
    June 2021
    April 2021
    March 2021
    February 2021
    December 2020
    November 2020
    October 2020
    September 2020
    August 2020
    July 2020
    June 2020
    May 2020
    April 2020
    March 2020
    February 2020
    January 2020
    December 2019
    November 2019
    October 2019
    September 2019
    August 2019
    July 2019
    June 2019
    May 2019
    April 2019
    March 2019
    February 2019
    January 2019
    December 2018
    November 2018
    October 2018
    September 2018
    August 2018
    July 2018
    June 2018
    May 2018
    April 2018
    March 2018
    February 2018
    January 2018
    December 2017
    November 2017
    October 2017
    September 2017
    August 2017
    July 2017
    June 2017
    May 2017
    April 2017
    March 2017
    February 2017
    January 2017
    December 2016
    November 2016
    October 2016
    September 2016
    August 2016
    July 2016
    June 2016
    May 2016
    April 2016
    March 2016
    February 2016
    January 2016
    December 2015
    November 2015
    October 2015
    September 2015
    August 2015
    July 2015
    June 2015
    May 2015
    April 2015
    March 2015
    February 2015
    January 2015
    December 2014
    November 2014
    October 2014
    September 2014
    August 2014
    July 2014
    June 2014
    May 2014
    April 2014
    March 2014
    February 2014

Proudly powered by Weebly
Photos used under Creative Commons from Picturepest, marcoverch, perzonseowebbyra, Picturepest, Picturepest, dsearls, dungodung, Massachusetts Office of Travel & Tourism, aqua.mech, vastateparksstaff, hile, Aaron Volkening, amishsteve, Neil DeMaster, mklwong88, KOMUnews, Picturepest, kaibara87