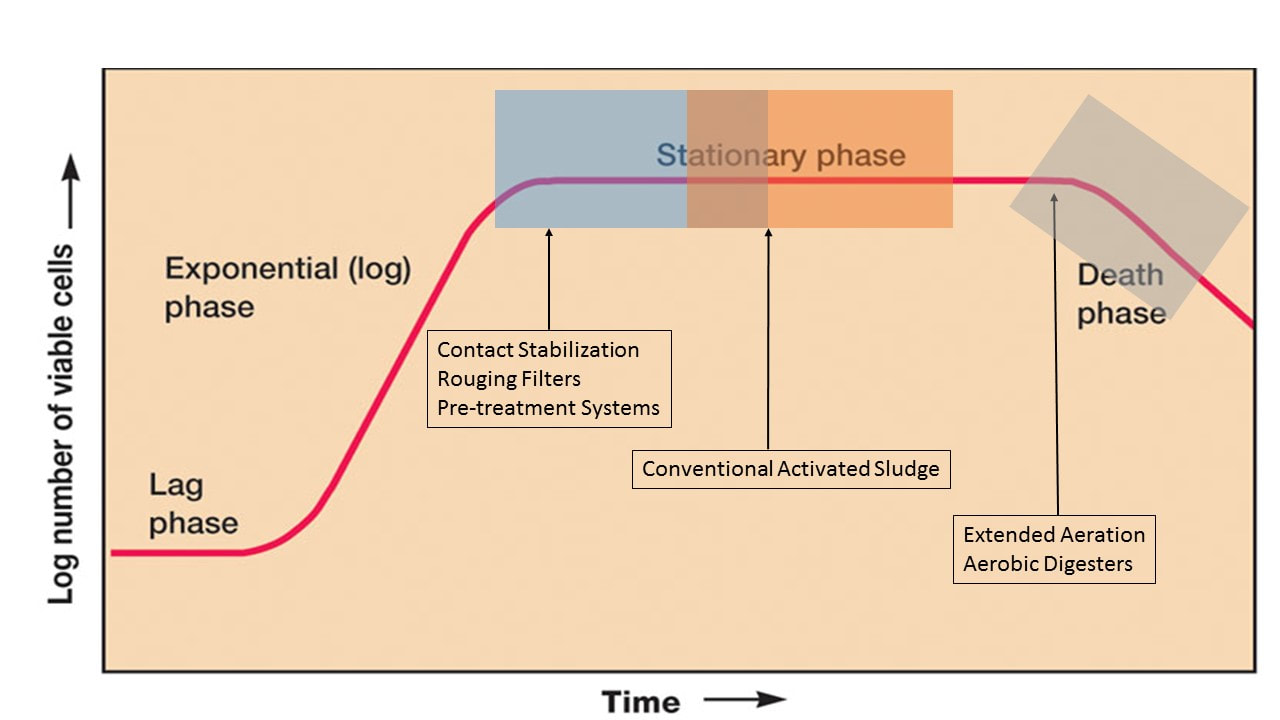
For those in need of refresh, the Growth Curve describes microbial populations by dividing growth into (1) Lag, (2) Log, (3) Stationary, and (4) Decline (endogenous) phases. Species of microbes differ based on influent composition and environmental factors, but we also have a changes in species based on waste concentrations relative to microbial populations - this is also known as F/M ratio.
The growth curve is easiest to see in aerated lagoon systems. Near the influent, we find lag and log phase growth as abundant food favors fast growing k-rate strategist microbes. As you increase Dissolved Oxygen (DO) and BOD/COD (food) declines, you see a change to r-rate strategists such as ammonia oxidizing bacteria (AOB), Thauera/Zooglea (biopolymer producing low F/M microbes), and other niche organisms. What I find interesting is how much change we see in our Microbial Community Analysis (a total census of all microbes in the system) with slight variations in F/M or influent makeup at inflection points along the growth curve.


 RSS Feed